Réponse rapide
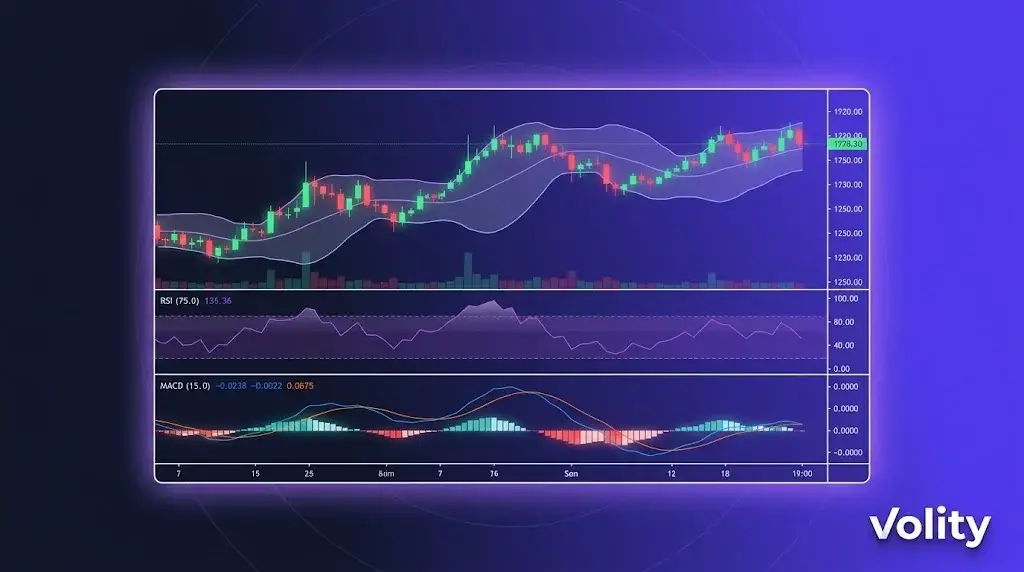
Les graphiques de trading crypto tracent le prix d’une pièce dans le temps et sont la base de l’analyse technique. Les graphiques en chandeliers sont les plus populaires, montrant l’ouverture, le plus haut, le plus bas et la clôture de chaque période. Lire les graphiques avec les lignes de tendance, les supports et résistances, le volume et les indicateurs aide les traders à chronométrer entrées et sorties. Sur Volity, les graphiques sont propulsés par TradingView.
Les graphiques de trading crypto sur Volity MT intègrent directement le moteur de graphiques de TradingView dans l’interface de trading. Vous bénéficiez de plus de 100 indicateurs techniques, d’outils de dessin personnalisés, de Pine Script pour des indicateurs sur mesure, de vues multi-périodes et de l’exécution d’ordres directement depuis le graphique. Les graphiques se synchronisent sur mobile, ordinateur et web. Cette page détaille les capacités graphiques et leur utilisation.
Graphiques de trading crypto sur Volity : ce que vous obtenez
Moteur TradingView intégré à Volity MT. Il ne s’agit pas d’une application séparée ; le panneau graphique dans Volity MT est TradingView. Cela signifie :
- Plus de 100 indicateurs techniques intégrés (RSI, MACD, Bandes de Bollinger, Ichimoku, Volume Profile, etc.)
- Indicateurs personnalisés via Pine Script
- Vues multi-périodes (ouvrez la même paire en 1m, 5m, 1h, 4h, journalier simultanément)
- Outils de dessin (lignes de tendance, Fibonacci, vagues d’Elliott, zones de volume profile)
- Dessins intelligents qui s’étendent automatiquement sur toutes les périodes
- Saisie d’ordres basée sur le graphique (cliquez sur un niveau de prix pour passer un ordre)
Données en temps réel derrière les graphiques de trading crypto
Données de tick en direct sur plus de 20 paires crypto, ainsi que sur le forex, les indices, les actions et les matières premières. Le même moteur d’exécution qui traite vos ordres alimente les prix des graphiques, de sorte que la cotation affichée correspond à celle sur laquelle votre ordre sera exécuté (dans la limite de la tolérance de slippage standard).
Streaming basé sur WebSocket avec une latence inférieure à 50ms entre la mise à jour de la cotation et le rendu graphique. Bande passante optimisée pour les connexions cellulaires sur mobile.
Flux de travail descendant multi-périodes
Un flux de travail courant combinant plusieurs périodes :
« 1. Graphique journalier : identifier la tendance (haussière, baissière, latérale) 2. Graphique 4 heures : trouver une configuration au sein de la tendance (pullback, cassure, retournement) 3. Graphique 1 heure : affiner le timing d'entrée sur la configuration 4. Graphique 15 minutes : temporiser l'entrée au sein de l'heure 5. Ticket d'ordre : placer le trade avec stop et objectif basés sur le niveau 4 heures «
Volity MT prend en charge ce flux de travail avec un réticule synchronisé, des paramètres d’indicateurs qui persistent sur toutes les périodes et la possibilité d’afficher la même paire sur plusieurs panneaux avec des périodes différentes.
Indicateurs qui valent la peine d’être appris
Cinq indicateurs qui couvrent la majeure partie de l’analyse technique de détail :
1. Moyennes mobiles (MA, EMA). Identification de la tendance. 50 et 200 sont les niveaux institutionnels standards.
2. RSI (Relative Strength Index). Momentum et surachat/survente. Seuils classiques 70/30 ; 80/20 pour des signaux plus forts.
3. MACD. Changements de tendance et shifts de momentum. Les signaux de croisement sont des déclencheurs d’entrée courants.
4. Bandes de Bollinger. Expansion/contraction de la volatilité. Les traders de range utilisent les touches des bandes ; les traders de cassure utilisent les sorties de bandes.
5. Volume Profile. Où le plus gros volume a été échangé à chaque niveau de prix. Identifie les zones de support/résistance avec une fiabilité supérieure aux lignes horizontales.
Plus de 100 autres indicateurs sont disponibles ; ces cinq constituent la base sur laquelle reposent la plupart des stratégies de détail.
Pine Script pour des indicateurs personnalisés
Si un indicateur intégré ne correspond pas à votre stratégie, Pine Script vous permet d’en créer des personnalisés. Pine est le langage de script de TradingView, conçu pour l’analyse technique.
Cas d’utilisation courants de Pine personnalisé : – Combiner plusieurs indicateurs en un signal composite unique – Ajouter des alertes sur des configurations multi-conditions spécifiques – Backtester visuellement une stratégie sur des données historiques – Créer des tracés personnalisés (par exemple, force relative d’un actif par rapport à un autre)
Les connaissances en Pine Script sont transférables entre les plateformes, les scripts écrits pour TradingView fonctionnent dans la couche graphique de Volity MT.
Saisie d’ordres basée sur le graphique
Trois façons de passer des ordres depuis le graphique :
1. Cliquer sur un niveau de prix. Faites un clic droit sur n’importe quel prix sur le graphique et sélectionnez « Acheter à ce niveau » ou « Vendre à ce niveau » pour définir un ordre limite. L’ordre persiste sur le graphique sous forme de ligne horizontale que vous pouvez déplacer.
2. Glisser-déposer pour passer des ordres. Avec le trading en un clic activé, faites glisser depuis le prix actuel vers un prix cible pour définir un take-profit. Faites glisser vers un niveau de stop pour définir le stop.
3. Barre latérale du panneau d’ordre. Ticket d’ordre standard à côté du graphique, avec des entrées pour la taille, l’effet de levier, le stop et l’objectif.
Synchronisation des graphiques entre les appareils
Les graphiques, indicateurs, dessins et listes de surveillance se synchronisent sur Volity MT mobile (iOS, Android), ordinateur (Windows, Mac) et web. Ouvrez sur votre téléphone la même mise en page de graphique que celle que vous avez fermée sur ordinateur. Les dessins persistent ; les alertes persistent.
Alertes
Définissez des alertes basées sur les graphiques pour :
- Niveaux de prix (au-dessus/en dessous)
- Croisements d’indicateurs (par exemple, le RSI croise 70)
- Touches d’outils de dessin (par exemple, le prix touche une ligne de tendance)
- Conditions Pine Script personnalisées
Les alertes sont transmises via notification dans l’application, notification push (mobile), e-mail et (pour les VIP) webhook vers vos propres systèmes.
Limitations
- La profondeur de l’historique des graphiques varie selon l’instrument : 5-10 ans sur les principales paires forex et crypto ; moins sur les altcoins à faible capitalisation
- L’exécution de Pine Script est isolée (sandbox) ; certaines fonctionnalités avancées (appels réseau, données externes) ne sont pas disponibles
- Les symboles personnalisés (spreads inter-actifs, instruments synthétiques) nécessitent une configuration manuelle
Sources
Outils de trading Volity associés
- Outils de trading sur Volity : Aperçu
- Crypto Copy Trading : Copiez des traders vérifiés
- Signaux de trading crypto : Appels d’achat et de vente sélectionnés
- Trading automatisé : EA, bots et API
- Volity MT : Plateforme de trading crypto
Questions fréquemment posées
Quels graphiques Volity propose-t-il pour le trading crypto ?
Volity MT intègre directement le moteur de graphiques de TradingView. Vous bénéficiez de plus de 100 indicateurs techniques, de Pine Script personnalisé, de vues multi-périodes, d’outils de dessin et de la saisie d’ordres depuis le graphique. Les mêmes graphiques fonctionnent sur mobile, ordinateur et web avec une synchronisation complète.
L’intégration TradingView est-elle gratuite ?
Oui. Les graphiques TradingView sont inclus avec votre compte Volity sans frais supplémentaires. Le même moteur qui alimente TradingView.com fonctionne à l’intérieur de Volity MT. Aucun abonnement TradingView séparé n’est requis pour utiliser les graphiques intégrés.
Puis-je utiliser Pine Script sur Volity ?
Oui. Pine Script est pris en charge dans la couche TradingView de Volity MT. Vous pouvez utiliser des scripts de la bibliothèque publique de TradingView, coller les vôtres ou écrire des indicateurs personnalisés. Les scripts qui fonctionnent sur TradingView.com fonctionnent dans Volity MT.
Les graphiques Volity fonctionnent-ils sur mobile ?
Oui. L’application mobile Volity (iOS et Android) inclut la couche graphique complète avec les mêmes indicateurs, outils de dessin et synchronisation. Les graphiques ouverts sur mobile correspondent aux graphiques ouverts sur ordinateur en temps réel.
Puis-je passer des trades directement depuis le graphique ?
Oui. Trois méthodes : clic droit sur un niveau de prix et sélection d’achat/vente, glisser depuis le prix actuel vers l’objectif/stop pour définir des ordres, ou utiliser le ticket d’ordre du panneau latéral. Les ordres persistent sur le graphique sous forme de lignes déplaçables.
Quelle est la latence sur les graphiques Volity ?
La latence typique de WebSocket entre le tick et le rendu est inférieure à 50ms. Le même moteur d’exécution qui traite vos ordres alimente les prix des graphiques, de sorte que la cotation affichée correspond à la cotation d’exécution dans la limite de la tolérance de slippage standard.
Les graphiques crypto sont-ils disponibles 24/7 ?
Oui pour les paires crypto. Volity affiche les graphiques crypto 24/7 pour correspondre au marché sous-jacent. Les graphiques forex suivent les heures du forex (dimanche 22:00 GMT au vendredi 22:00 GMT). Les graphiques des matières premières, indices et actions suivent leurs heures de marché respectives.


