Réponse rapide
Un compte de résultat en trading montre vos gains et pertes réalisés et latents sur une période, pour voir si votre trading est réellement rentable après les coûts. Il liste les gains, les pertes, les frais et le résultat net. Lire régulièrement votre compte de résultat est la façon dont les traders disciplinés suivent leur performance et repèrent les fuites comme le surtrading ou les frais.
Se concentrer sur les profits et pertes (P/L) non réalisés sans tenir compte des pertes latentes peut créer un biais psychologique favorisant un trading basé sur l’espoir, où les positions perdantes sont conservées indéfiniment. Une seule perte catastrophique lors d’une cascade de liquidations peut effacer des mois de profits réalisés accumulés avec soin. Calculer le P/L net sans inclure les coûts cachés, tels que les frais de swap au jour le jour et les spreads sur les paires à large écart, sous-estime les coûts de trading totaux. Utiliser des données de P/L provenant de sessions à faible volume ou de pics provoqués par des nouvelles comme base de validation d’une stratégie conduit à des conclusions erronées sur l’avantage de la stratégie. Les performances passées ne préjugent pas des résultats futurs. Capital à risque.
Un état des profits et pertes (P/L) est l’enregistrement quantitatif de la performance financière d’un trader sur une période donnée. En 2026, l’analyse professionnelle du P/L sépare les gains réalisés des positions « latentes » non réalisées pour évaluer avec précision la santé du compte et le risque de marge. La maîtrise de mesures avancées comme la Rentabilité Moyenne par Trade (APPT) permet aux investisseurs de distinguer la chance aléatoire d’un avantage de trading validé mathématiquement.
L’état des profits et pertes (P/L) fonctionne comme le tableau de bord objectif de chaque participant au marché. Cet enregistrement financier identifie le résultat net précis des trades exécutés après avoir comptabilisé toutes les dépenses liées au marché. Il sert de base fondamentale pour l’audit de performance et la déclaration fiscale dans l’écosystème financier mondial. Comprendre comment calculer la marge sur le forex est essentiel pour interpréter correctement l’impact des variations du P/L sur la sécurité de votre compte.
Le paysage de l’investissement en 2026 exige une compréhension sophistiquée de la manière dont les profits « virtuels » non réalisés interagissent avec les capitaux propres réels du compte. Maîtriser la distinction entre ces deux états du P/L permet aux investisseurs de gérer les niveaux de marge avec une précision institutionnelle et un contrôle émotionnel.
Comprendre Profit-Loss Statement est important, mais la vraie progression commence en appliquant ces connaissances. Créez votre compte de trading forex gratuit pour vous entraîner sur un compte démo gratuit et mettre votre stratégie à l’épreuve.
Qu’est-ce qu’un état des P/L dans le trading forex ?
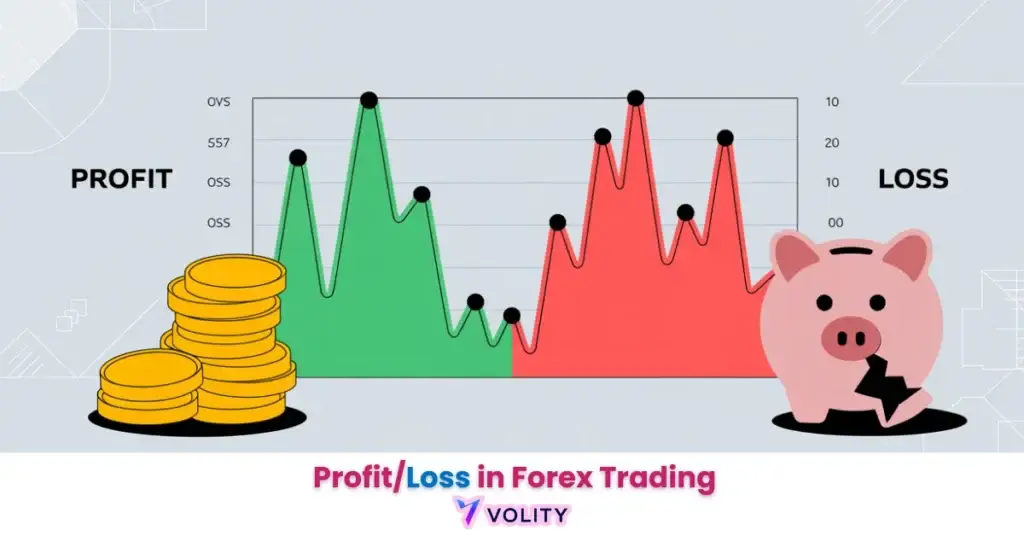
Un état des profits et pertes est un résumé complet qui identifie les résultats financiers nets de toutes les activités de trading sur un horizon temporel défini.
Cet enregistrement suit les prix d’ouverture et de clôture, les tailles de lots, les commissions et les swaps. L’onglet historique du compte sur la plateforme de trading sert de source de données brutes. Lorsqu’ils sont agrégés sur une période de trading (quotidienne, hebdomadaire, mensuelle ou annuelle), l’état des P/L révèle le résultat net de toutes les transactions combinées.
- Définition du P/L (Profit and Loss) et PNL
- Composants : Prix d’ouverture/clôture, tailles de lots, commissions et swaps
- Le rôle de l’onglet « Historique du compte » comme source de données brutes
Le volume mondial du FX a atteint 9,6 billions de dollars par jour en 2026, augmentant la complexité du suivi du P/L en raison des réévaluations de ticks à haute fréquence (Audit de performance BIS, 2026).
Rentabilité brute vs nette
La rentabilité nette identifie le gain final après avoir soustrait les coûts de trading inévitables de l’appréciation brute du prix.
Le profit brut est la différence brute entre les prix d’entrée et de sortie multipliée par la taille du lot. Le profit net soustrait le coût du spread bid-ask, la commission du courtier et les frais de swap au jour le jour. Un mouvement de 50 pips qui génère 500 USD de profit brut peut ne rapporter que 473 USD après les coûts, illustrant pourquoi l’efficacité des transactions favorise la rentabilité à long terme.
Prêt à faire passer votre trading au niveau supérieur ?
Vous avez les connaissances. Il vous manque la plateforme. Rejoignez des milliers de traders qui choisissent Volity pour ses outils puissants, son exécution rapide et son support dédié.
Créez votre compte en moins de 3 minutesP/L réalisé vs non réalisé : La norme de risque 2026
Le P/L réalisé identifie le résultat financier final des trades clôturés, tandis que le P/L non réalisé suit la valorisation tick par tick des positions ouvertes. Comprendre la relation entre P/L non réalisé vs P/L latent est essentiel pour éviter les événements de liquidation inattendus.
Le P/L non réalisé (latent) pilote les calculs de « marge libre » et de « niveau de marge » en temps réel. Lorsqu’une position ouverte évolue contre le trader, les pertes non réalisées réduisent immédiatement la marge disponible. Le P/L réalisé représente les gains ou pertes verrouillés qui affectent définitivement le solde du compte une fois les trades clôturés. Ne pas surveiller ces fluctuations peut mener directement à une séquence de Margin Call vs Stop Out.
Le danger du trading basé sur l’espoir émerge lorsque les traders conservent indéfiniment des pertes latentes, attendant que le prix se redresse. Un portefeuille qui accumule de lourdes pertes non réalisées devient structurellement fragile lors des pics de nouvelles à fort impact.
P/L non réalisé vs P/L latent explique la distinction technique et les mécanismes d’impact sur la marge.
Comment calculer le P/L sur un seul trade ?
Le calcul manuel du P/L détermine l’impact monétaire du mouvement des prix en multipliant la distance en pips par la valeur spécifique du pip et la taille du lot. Savoir ce qu’est un lot sur le forex garantit que vous adaptez correctement vos calculs à la taille de votre position.
(Sortie – Entrée) × Taille × Valeur du pip = P/L brut est la formule standard. Pour une position longue, les hausses de prix génèrent du profit ; pour les positions courtes, les baisses de prix génèrent du profit. La conversion de devise devient nécessaire lorsque la devise de la position diffère de la devise de base du compte.
Exemple de trading réel : un trader EUR/USD achète 1 lot standard à 1,1000 et clôture à 1,1050, capturant 50 pips. Le calcul est 50 × 10 USD par pip × 1 = 500 USD de profit brut. Après un coût de spread de 20 USD et une commission de 7 USD, le P/L réalisé net est de 473 USD. Les performances passées ne préjugent pas des résultats futurs.
Comparaison : Mesures essentielles de performance du P/L
Les mesures de performance diagnostiques identifient les indicateurs de santé spécifiques à évaluer pour déterminer la durabilité à long terme d’un trader.
| Métrique | Description | Impact sur le compte |
| P/L réalisé | Total des gains/pertes clôturés | Croissance du solde |
| P/L non réalisé | Valorisation actuelle ouverte | Stabilité de la marge |
| Ratio Gain/Perte | Ratio des gains sur les pertes | Efficacité du risque |
| APPT | Profit moyen par trade | Avantage à long terme |
| Drawdown | Baisse max. pic à creux | Sécurité du capital |
Drawdown en trading explique comment la perte maximale impacte la longévité du compte.*
Surveiller ces mesures fournit des signaux d’alerte précoces en cas de dégradation de la stratégie ou d’escalade du risque sur le compte.
Qu’est-ce que l’APPT et pourquoi est-ce important ?
La Rentabilité Moyenne par Trade (APPT) identifie l’espérance mathématique d’un système de trading sur un large échantillon. L’application de cadres de Gestion des risques institutionnels garantit que votre APPT reste positive sur de longs horizons temporels.
APPT = (Taux de gain × Gain moyen) – (Taux de perte × Perte moyenne) est la formule de base. Une stratégie avec un taux de gain de 40 % mais un ratio récompense/risque de 3:1 peut être très rentable car les gains moyens plus importants compensent la fréquence plus élevée des pertes. Utiliser l’APPT pour détecter les « valeurs aberrantes chanceuses » révèle quand un seul gain massif cache un système fondamentalement défaillant.
Les journaux de trading professionnels de 2026 privilégient l' »Écart-type de l’APPT » pour garantir que les rendements sont cohérents plutôt qu’erratiques, séparant l’avantage réel de la volatilité induite par le bruit.
Les cadres de Gestion des risques soulignent qu’un APPT supérieur à +10 USD par trade démontre une rentabilité de stratégie authentique.
Transformez vos connaissances en profit
Vous avez lu, il est temps d’agir. La meilleure façon d’apprendre, c’est en pratiquant. Ouvrez un compte démo gratuit et sans risque et entraînez votre stratégie avec des fonds virtuels dès aujourd’hui.
Ouvrir un compte démo gratuitAffiner la stratégie par l’analyse du P/L
La segmentation historique du P/L identifie les conditions de marché et les actifs spécifiques où un trader possède un véritable avantage technique.
Passer en revue le P/L par session (Londres vs NY) révèle si la stratégie fonctionne dans toutes les conditions de marché ou seulement pendant des périodes spécifiques. Passer en revue par classe d’actifs (Forex vs Crypto) montre quels instruments s’alignent avec l’approche de trading. Cette segmentation empêche de tirer des conclusions erronées sur l’avantage de la stratégie à partir de périodes d’échantillonnage non représentatives.
Erreurs de trading courantes à éviter répertorie les erreurs analytiques qui amènent les traders à mal interpréter les données de P/L.
Trading des figures en biseau démontre les modèles de consolidation qui produisent souvent des trades gagnants cohérents dans les enregistrements de P/L.
Points clés
- L’état des profits et pertes est l’enregistrement financier principal qui suit le résultat net de toutes les activités de trading au fil du temps.
- Le P/L réalisé représente les gains ou pertes finaux qui ont été verrouillés dans le solde du compte après la clôture d’une position.
- Le P/L non réalisé est la valorisation tick par tick des trades ouverts, ce qui affecte directement la marge libre et les capitaux propres du compte.
- Le calcul du profit net nécessite de soustraire tous les coûts de transaction, y compris les spreads, les commissions et les swaps au jour le jour.
- L’APPT (Rentabilité Moyenne par Trade) mesure l’espérance mathématique d’une stratégie, confirmant un avantage réel.
- La segmentation du P/L permet aux traders d’identifier quelles sessions, quels actifs ou quelles configurations sont les principaux moteurs de la croissance de leur compte.
Questions fréquemment posées
Cet article contient des références à l’état des profits et pertes et à Volity, une plateforme de trading de CFD réglementée. Ce contenu est produit à des fins éducatives uniquement et ne constitue pas un conseil financier ou une recommandation d’achat ou de vente d’un instrument financier. L’analyse de l’état des P/L nécessite une attention particulière aux positions réalisées et non réalisées. Segmentez toujours vos données de P/L avec soin avant de tirer des conclusions sur l’avantage de votre stratégie. Certains liens dans cet article peuvent être des liens d’affiliation.