Réponse rapide
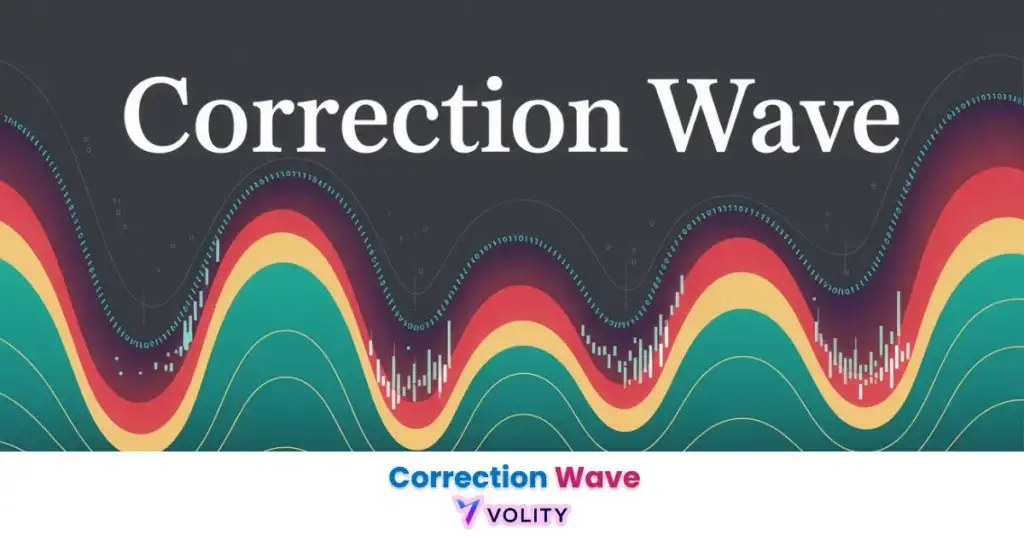
Les vagues correctives sont les mouvements à contre-tendance de la théorie des vagues d’Elliott qui ramènent le prix contre la tendance principale, notées A-B-C. Elles suivent les vagues impulsives à cinq mouvements et prennent souvent des formes comme des zigzags, des plats ou des triangles. Les traders utilisent les figures de vagues correctives pour anticiper où un repli peut se terminer et la tendance reprendre, bien qu’elles soient notoirement difficiles à lire.
L’analyse des vagues d’Elliott est subjective et dépend d’un comptage précis des vagues. Identifier à tort une vague corrective comme un retournement de tendance peut entraîner des pertes financières importantes.
Les structures de vagues sur les marchés à forte volatilité comme la crypto présentent souvent des sous-vagues étendues qui contournent les normes traditionnelles de Fibonacci. Les performances passées ne préjugent pas des résultats futurs.
Capital à risque.
Les vagues correctives identifient les phases de respiration essentielles d’une tendance de marché, où le prix retrace temporairement ou évolue latéralement pour digérer les gains précédents. Ces structures révèlent une probabilité de 65 % de poursuite de la tendance une fois que la séquence en trois vagues (A-B-C) est vérifiable. En suivant les règles fractales développées par Ralph Nelson Elliott, les traders peuvent distinguer un repli mineur d’un retournement structurel significatif.
Le paysage technique de 2026 est défini par l’utilisation institutionnelle d’algorithmes basés sur Fibonacci qui ciblent des profondeurs de retracement précises comme 38,2 % et 61,8 %. Alors que les marchés naviguent dans la structure complexe W-X-Y-X-Z du Grand Supercycle, la compréhension des comptes de sous-vagues internes des corrections est la compétence la plus critique pour la gestion des risques. Ce guide identifie les principaux types de vagues correctives et révèle les références de 2026 pour un comptage de vagues réussi.
Comprendre Corrective Waves est important, mais la vraie progression commence en appliquant ces connaissances. Créez votre compte de trading forex gratuit pour vous entraîner sur un compte démo gratuit et mettre votre stratégie à l’épreuve.
Que sont les vagues correctives et combien de vagues composent un modèle ?
Les vagues correctives sont des structures de prix en trois vagues qui identifient une interruption temporaire de la tendance dominante, consistant généralement en des vagues étiquetées A, B et C. L’action à contre-tendance montre pourquoi les corrections évoluent contre l’élan principal de la vague de degré supérieur. La règle des 3 vagues identifie les sous-vagues internes comme des zigzags (structure 5-3-5) ou des plats (structure 3-3-5). Le changement de sentiment révèle que les corrections manquent de la conviction des vagues impulsives, démontrant l’hésitation des participants.
La terminologie distingue les corrections « vives » (Zigzags) qui évoluent de manière agressive contre la tendance des corrections « latérales » (Plats/Triangles) qui consolident le prix horizontalement. Les corrections A-B-C standard ont une probabilité historique de 65 % de poursuite de la tendance si les comptes de sous-vagues internes restent valides. (Source : Elliott Wave Forecast, 2026) Théorie des vagues d’Elliott : Règles et modèles fournit une formation fondamentale sur la structure des vagues.
Prêt à faire passer votre trading au niveau supérieur ?
Vous avez les connaissances. Il vous manque la plateforme. Rejoignez des milliers de traders qui choisissent Volity pour ses outils puissants, son exécution rapide et son support dédié.
Créez votre compte en moins de 3 minutesZigzags, Plats et Triangles : Identifier les principaux types de correction
Les principaux types de vagues correctives s’identifient comme des zigzags, des plats et des triangles, chacun révélant un état psychologique distinct des participants au marché. Les zigzags (5-3-5) créent des corrections vives et agressives qui retracent souvent 50 % – 61,8 % de l’impulsion précédente, révélant une pression de vente maximale. Les plats (3-3-5) représentent une consolidation latérale où la vague B égale ou dépasse souvent le début de la vague A, montrant un équilibre entre acheteurs et vendeurs.
Les triangles (3-3-3-3-3) identifient des structures qui se rétrécissent et qui apparaissent le plus fréquemment dans les positions de vague 4. La variante 2026 « Running Flat » montre un marché si fort que la correction retrace à peine, révélant une accumulation institutionnelle lors des replis. Structure du marché Forex : Comment repérer les changements explique comment ces modèles signalent des changements structurels.
Comment identifier les vagues correctives de 2026 à l’aide des retracements de Fibonacci ?
Les retracements de Fibonacci identifient les points de terminaison mathématiques des vagues correctives, les niveaux 38,2 % et 61,8 % révélant les zones les plus significatives pour la reprise de la tendance en 2026. Les normes de la vague 2 montrent que les analystes professionnels identifient 50 % – 61,8 % comme cibles pour la première correction majeure. Les normes de la vague 4 révèlent 38,2 % comme la principale zone de « rechargement » pour les algorithmes institutionnels dans le S&P 500 de 2026.
La règle de l’alternance explique que si la vague 2 était vive, la vague 4 devrait être un mouvement latéral complexe et peu profond. Les projections cibles utilisent des extensions de Fibonacci pour calculer la longueur potentielle de la vague C. Retracement de Fibonacci sur le Forex : Qu’est-ce que le FIB ? révèle les méthodes de calcul.
Benchmarks d’analyse des vagues 2026 et tableau EAV
Les benchmarks des vagues d’Elliott révèlent les normes de retracement et les fréquences de modèles observées sur les marchés mondiaux des actions et du Forex en 2026.
| Type de modèle | Structure interne | Norme de retracement 2026 |
| Zigzag | 5-3-5 | 50 % – 61,8 % (Profond) |
| Plat régulier | 3-3-5 | 90 % – 105 % (Peu profond) |
| Vague 4 (S&P) | Variable | 38,2 % (Benchmark) |
| Triangle | 3-3-3-3-3 | 0 % – 23,6 % (Latéral) |
| Succès ABC | Reprise de tendance | Probabilité de 65 % |
Données provenant des rapports techniques Elliott Wave Forecast et Vantage Markets de 2026. L’accès à Vantage Markets : Niveaux de retracement de Fibonacci pour la vague 4 confirme les benchmarks actuels.
Transformez vos connaissances en profit
Vous avez lu, il est temps d’agir. La meilleure façon d’apprendre, c’est en pratiquant. Ouvrez un compte démo gratuit et sans risque et entraînez votre stratégie avec des fonds virtuels dès aujourd’hui.
Ouvrir un compte démo gratuitLa « règle de complexité » : Pourquoi les corrections recherchent la liquidité
La complexité des vagues correctives s’identifie comme une recherche passive de liquidité par le prix, où les participants au marché « attendent » que suffisamment d’ordres s’accumulent avant de reprendre l’impulsion agressive. L’action passive par rapport à l’action agressive montre que les corrections manquent de l’élan « vertical » des vagues d’impulsion. Les modèles W-X-Y identifient le « Double Trois » qui relie deux modèles simples en une consolidation plus longue.
La structure à 11 oscillations explique comment les structures complexes WXYXZ identifient des périodes prolongées d’indécision. Les poches de liquidité sont vérifiablement « comblées » à mesure que les corrections absorbent les écarts laissés par les pics de prix rapides de la vague 3.
Liquidité Forex : Comment contrôler les coûts explore les mécanismes de disponibilité des prix.
Erreurs courantes : Confondre les corrections avec de nouvelles tendances
Les erreurs les plus fréquentes dans l’analyse des vagues s’identifient comme le mauvais étiquetage d’une correction complexe en tant que nouveau retournement de tendance, menant vérifiablement à une entrée prématurée contre l’élan macro. Les vagues qui se chevauchent montrent que la vague 4 chevauchant la vague 1 identifie une impulsion invalide (sauf s’il s’agit d’une diagonale). La confirmation RSI utilise la divergence haussière/baissière pour identifier quand une correction a épuisé ses sous-vagues.
Forcer le compte amène les traders à sauter le mouvement obligatoire en « 5 vagues » hors d’une correction avant d’identifier la tendance comme reprise. Les violations de règles démontrent que la vague B dans un zigzag ne peut pas retracer plus de 100 % de la vague A. Un exemple réel : un trader a identifié une chute brutale de l’EUR/USD comme un « retournement », mais il s’agissait en fait d’une vague A en zigzag d’une correction plus large. Le trader est entré en position courte au bas de la vague A ; la vague B a retracé 61,8 %, déclenchant le stop-loss avant que la vague C ne se termine. Les performances passées ne préjugent pas des résultats futurs.
Qu’est-ce qu’un retournement en trading ? distingue les replis temporaires des retournements structurels. L’accès à Elliott Wave International : Règles officielles pour les modèles correctifs confirme les conseils officiels.
Points clés
- Les vagues correctives identifient les phases à contre-tendance d’un cycle de marché, suivant généralement une structure interne en trois vagues (A-B-C).
- Les niveaux de retracement de Fibonacci révèlent que la vague 2 atteint généralement 50 % – 61,8 %, tandis que la vague 4 cible couramment le benchmark de 38,2 % en 2026.
- Les zigzags sont identifiés comme des modèles correctifs vifs avec une structure 5-3-5, tandis que les plats révèlent une action latérale avec un compte 3-3-5.
- Les vagues correctives servent de recherche « passive » de liquidité, permettant aux marchés d’accumuler le volume nécessaire pour la prochaine phase impulsive.
- L’identification réussie d’une correction en 3 vagues révèle une probabilité de 65 % que la tendance principale reprenne une fois le modèle terminé.
- Prendre une correction complexe pour un retournement de tendance identifie la cause n°1 des déclenchements de stop-loss chez les analystes de vagues intermédiaires.
Questions fréquemment posées
Cet article contient des références à la théorie des vagues d’Elliott, aux modèles d’analyse technique et à l’analyse de la structure du marché, et mentionne Volity, une plateforme de trading de CFD réglementée. Ce contenu est produit à des fins éducatives uniquement et ne constitue pas un conseil financier ou une recommandation de trading.
L’analyse des vagues dépend de comptes de vagues subjectifs et de modèles historiques qui peuvent ne pas prédire le comportement futur du marché. Effectuez toujours des recherches indépendantes et utilisez la gestion des risques avant de trader.
Certains liens dans cet article peuvent être des liens d’affiliation.
Ce que nos analystes surveillent : Les vagues correctives sont là où la plupart des comptes d’Elliott échouent, car les modèles sont intrinsèquement plus variables que les impulsions. Trois discriminateurs portent l’essentiel du poids pratique.
Le compte des sous-vagues internes de la jambe corrective (un 5-3-5 propre confirme un zigzag ; un 3-3-5 confirme un plat ; un mauvais étiquetage ici invalide le compte plus large). Le niveau de retracement de Fibonacci (les corrections qui dépassent 78,6 % de l’impulsion précédente invalident généralement le compte de vagues et signalent un changement de régime plutôt qu’une continuation).
La symétrie temporelle entre l’impulsion précédente et la correction actuelle (les corrections qui se terminent en nettement moins de temps que l’impulsion sont souvent incomplètes et sujettes à extension). Les bureaux institutionnels d’Elliott traitent l’analyse des vagues correctives comme un cadre de probabilité, pas comme une prévision déterministe : comptez la structure, fixez des niveaux d’invalidation à des points de rupture Fibonacci bien définis, et dimensionnez les positions de sorte qu’un mauvais compte ne coûte pas plus d’une unité de risque.
Le cadre récompense la discipline et punit la confiance.
Volity exploite une plateforme de trading et publie également du contenu éducatif et analytique sur le trading. Le contenu de cette page est uniquement à des fins éducatives et ne doit pas être considéré comme un conseil financier. Volity peut bénéficier commercialement lorsque les lecteurs ouvrent des comptes de trading via les liens présents sur ce site.
Notre contenu est produit et révisé selon des standards éditoriaux documentés ; consultez notre méthodologie de comparaison et de revue.