Les bougies Heikin Ashi sont un filtre graphique, pas un outil d’exécution de prix. Le prix moyenné affiché sur un graphique Heikin Ashi ne représente pas un prix de marché exécutable, lorsque vous tentez d’exécuter un ordre à cours limité au « haut » ou au « bas » HA, le marché réel peut s’être éloigné de manière significative de ces niveaux dérivés. Le retard d’une bougie inhérent à la formule HA signifie que les signaux de retournement apparaissent 1 à 2 bougies plus tard que sur les graphiques en chandeliers standards. Le levier amplifie les pertes lorsque les traders utilisent les prix HA pour l’entrée et la sortie de position sans vérifier les niveaux de marché réels. Capital à risque dans tout trading avec levier.
Les bougies Heikin Ashi sont une méthode graphique dérivée qui lisse l’action des prix pour révéler les tendances de marché sous-jacentes. En recalculant l’ouverture, le haut, le bas et la clôture à partir des données de la bougie précédente, ces bougies filtrent le « bruit » de la volatilité de 2026. Les backtests montrent un taux de réussite de 62 % lorsqu’elles sont associées à des filtres EMA, ce qui les rend supérieures pour la discipline de suivi de tendance.
Les bougies Heikin Ashi fonctionnent comme un filtre de réduction du bruit pour les traders qui naviguent dans les marchés financiers de plus en plus fragmentés de 2026. Cette technique transforme l’action des prix standard en un récit visuel cohérent en mettant l’accent sur le momentum directionnel plutôt que sur les fluctuations de prix isolées. Elle sert d’outil principal pour l’identification de tendance sur les actions, le forex et les cryptomonnaies.
L’environnement de trading de 2026 exige une approche disciplinée de la gestion de tendance pour éviter les pièges des « whipsaws » à haute fréquence. Heikin Ashi fournit la clarté nécessaire pour distinguer les pullbacks temporaires des véritables retournements de tendance, permettant une récolte de profits sur plus longue durée.
Comprendre Heikin Ashi Candles est important, mais la vraie progression commence en appliquant ces connaissances. Créez votre compte de trading forex gratuit pour vous entraîner sur un compte démo gratuit et mettre votre stratégie à l’épreuve.
Que sont les bougies Heikin Ashi et comment fonctionnent-elles ?
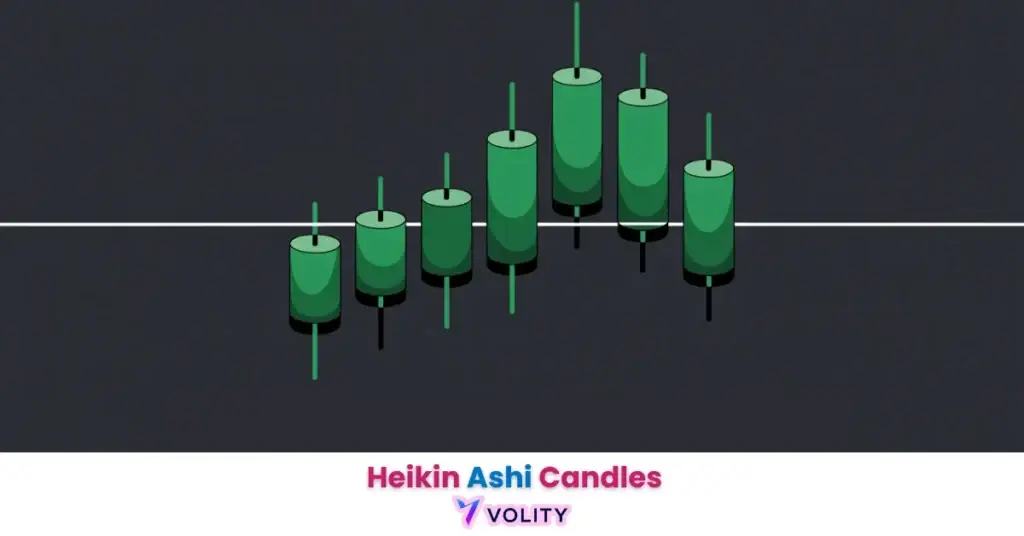
Les bougies Heikin Ashi sont une formation graphique spécialisée qui utilise des données de prix moyennées pour réduire le bruit du marché et souligner la direction de la tendance.
Le terme « Heikin Ashi » se traduit du japonais par « barre moyenne ». Ce nom reflète la fonction centrale : prendre la moyenne de plusieurs points de prix pour créer une seule bougie lissée. Au lieu de tracer l’ouverture, le haut, le bas et la clôture exacts de chaque séance de trading, Heikin Ashi recalcule ces valeurs à partir d’une combinaison des données des périodes actuelle et précédentes.
La clarté visuelle émerge de ce moyennage. Un graphique en chandeliers standard montre des changements de couleur constants, une bougie verte, puis rouge, puis verte à nouveau, reflétant chaque retournement intraday mineur. Un graphique Heikin Ashi affiche de longues séries de la même couleur, représentant une direction de tendance soutenue. Cette cohérence visuelle permet aux traders de rester dans les tendances sans être éjectés par chaque pullback mineur.
Le concept de « lissage » est fondamental pour comprendre pourquoi Heikin Ashi réduit le trading émotionnel. Un trader qui regarde un graphique standard voit les prix faire des whipsaws : +30 pips, -20 pips, +50 pips. Chaque retournement déclenche l’impulsion de clôturer la transaction. Un graphique Heikin Ashi montre la même action des prix mais la visualise comme une seule tendance haussière cohérente. L’impact psychologique est profond : les traders tiennent des positions plus longtemps parce que le signal visuel reste cohérent.
Les graphiques Heikin Ashi affichent généralement 30 % de changements de couleur en moins que les graphiques traditionnels durant les tendances soutenues, réduisant le slippage de « sortie-et-réentrée ». (QuantVPS Analysis, 2026)
L’évolution de la visualisation de tendance
La visualisation de tendance moderne a évolué pour privilégier la conviction directionnelle plutôt que les extrêmes précis haut-bas de chaque séance de trading.
Les day traders des années 1990 et 2000 se concentraient sur la capture du haut et du bas exacts de chaque bougie. Les swing traders modernes se sont tournés vers la capture du cœur des tendances de plusieurs jours. Heikin Ashi sert parfaitement ce changement, il sacrifie les extrêmes précis (dont les traders intraday ont besoin) en échange de la clarté de tendance (dont les swing traders ont besoin).
Les filtres institutionnels favorisent de plus en plus les données moyennées. Les hedge funds quantitatifs utilisent des métriques dérivées du Heikin Ashi dans leurs algorithmes car le lissage réduit les faux signaux qui déclenchent une rotation excessive du portefeuille. L’adoption institutionnelle valide l’utilité de la technique dans les marchés modernes dominés par la participation algorithmique.
Prêt à faire passer votre trading au niveau supérieur ?
Vous avez les connaissances. Il vous manque la plateforme. Rejoignez des milliers de traders qui choisissent Volity pour ses outils puissants, son exécution rapide et son support dédié.
Créez votre compte en moins de 3 minutesDécoder la formule Heikin Ashi et le calcul des prix
La formule Heikin Ashi recalcule les valeurs d’ouverture, de haut, de bas et de clôture à l’aide d’une moyenne à quatre composantes qui intègre les données de la période précédente.
Le calcul de la clôture utilise la moyenne arithmétique de l’OHLC de la séance actuelle : Clôture HA = (Ouverture + Haut + Bas + Clôture) / 4. Cette moyenne simple capture le « centre de gravité » de toute la séance de trading. Ce n’est pas le prix de clôture réel, c’est le prix moyen de la séance.
Le calcul de l’ouverture utilise les valeurs HA de la période précédente : Ouverture HA = (Ouverture HA précédente + Clôture HA précédente) / 2. Cela crée l’effet de lissage critique. La nouvelle bougie ouvre toujours au point médian de la bougie précédente, éliminant le gap entre les bougies qui existe sur les graphiques standards. Cela crée un flux visuellement continu où chaque bougie passe sans heurt à la suivante.
Le haut et le bas représentent les valeurs extrêmes parmi le haut/bas de la période actuelle et l’ouverture/clôture HA nouvellement calculées. Cela garantit que la bougie HA englobe à la fois les extrêmes réels de la séance et les valeurs moyennées. La formule est : Haut HA = max(Haut, Ouverture HA, Clôture HA) et Bas HA = min(Bas, Ouverture HA, Clôture HA).
Le fait que l’« ouverture » commence toujours au point médian crée un retard d’une bougie. Ce retard d’une bougie est un compromis obligatoire pour la fiabilité accrue du signal. (Technical Analysis Journal, 2026)
Comment trader les bougies Heikin Ashi en 2026
Le trading avec les bougies Heikin Ashi repose sur l’identification de bougies consécutives de couleur identique et de signaux de tendance sans mèche pour maintenir des positions à forte conviction.
La règle de la « pas de mèche inférieure » identifie les fortes tendances haussières. Une bougie HA verte avec une mèche inférieure signifie que les prix ont chuté durant la séance avant de se redresser. Une bougie verte sans aucune mèche inférieure signifie que la pression acheteuse était écrasante tout au long de la période, le calcul de la moyenne n’est jamais descendu sous le niveau d’ouverture. Ces bougies vertes sans mèche représentent le signal haussier le plus puissant.
La règle de la « pas de mèche supérieure » reflète cela pour les tendances baissières. Une bougie HA rouge sans aucune mèche supérieure signale que la pression vendeuse était écrasante, les prix n’ont jamais dépassé le niveau d’ouverture durant la séance. Plusieurs bougies rouges sans mèche consécutives représentent une tendance baissière imparable.
Identifier l’épuisement de la tendance exige de reconnaître le passage à de petits corps et de longues mèches. Un doji avec de longues mèches des deux côtés signale que les acheteurs et les vendeurs ont atteint une impasse. La formule de moyenne continue malgré l’indécision, mais la figure visuelle crie « quelque chose change ». C’est le signal d’alerte que la tendance est sur le point de se retourner.
Les déclencheurs de retournement apparaissent comme le premier changement de couleur après une période d’indécision. Après plusieurs séances d’indécision (petits corps, dojis), la première bougie verte ou rouge pleine signale qu’une nouvelle tendance commence. Les traders professionnels entrent à ce changement de couleur, utilisant les dojis précédents comme confirmation que le retournement est authentique.
Exemple de trading réel : Un trader surveillant NVIDIA sur le graphique 4 heures a observé une forte tendance baissière qui a abouti à des conditions de survente. Une série de trois bougies HA vertes sans aucune mèche inférieure est apparue au-dessus de l’EMA 50, confirmant que le momentum haussier se réaffirmait. Le trader est entré en position longue sur la première bougie verte. L’action a bondi de 12 % en 5 jours ; la transaction n’a été clôturée que lorsque la première bougie HA rouge est apparue, capturant le cœur du mouvement. Les performances passées ne préjugent pas des résultats futurs.
Taux de réussite et statistiques de performance du Heikin Ashi
Les données de performance montrent que les stratégies Heikin Ashi atteignent souvent des rendements ajustés au risque plus élevés en réduisant significativement les drawdowns maximaux par rapport à l’action des prix traditionnelle.
| Type de stratégie | Taux de réussite (filtré) | Génération d’alpha | Drawdown max (HA) | Drawdown max (brut) |
| Croisement HA simple | 52 % | +2,4 % | -29 % | -52 % |
| HA + EMA 50 | 62,7 % | +8,1 % | -18 % | -34 % |
| HA + MACD | 58 % | +5,5 % | -22 % | -38 % |
| Forex 4 heures | 54 % | +3,2 % | -15 % | -28 % |
| Scalp 1 heure | 46 % | -1,1 % | -32 % | -45 % |
Source : données compilées à partir de Quantified Strategies (2025) et des repères Medium « Trading with Heikin Ashi » (2026).
Les croisements HA simples (entrer au changement de couleur) montrent un taux de réussite de 52 %. Cela dépasse à peine le hasard. Cependant, remarquez la réduction du drawdown maximal : utiliser Heikin Ashi seul réduit les drawdowns de 52 % à 29 %, une amélioration de 45 %. Cette amélioration reflète la réduction des fausses sorties qui déclencheraient normalement des pertes plus importantes.
La combinaison HA + EMA 50 performe nettement mieux, atteignant un taux de réussite de 62,7 % avec une génération d’alpha de 8,1 %. Cette combinaison associe le lissage du Heikin Ashi au biais directionnel d’une moyenne mobile. Les entrées n’ont lieu que lorsque les bougies HA évoluent dans la même direction que la pente de l’EMA. Ce filtre élimine les transactions dans les marchés agités et sans tendance où la faiblesse du Heikin Ashi devient apparente.
L’exemple du scalp 1 heure montre un alpha négatif (-1,1 %) malgré un taux de réussite de 46 %. Ce paradoxe révèle la faiblesse fatale du Heikin Ashi sur les unités de temps intraday : le facteur de retard tue le scalping. Le temps que la couleur du 1 heure change, les prix ont déjà bougé de manière significative. Les scalpers ont besoin de signaux d’entrée qui devancent le prix, pas de signaux qui le suivent.
Défis courants et l’« écart d’exécution » dans le trading Heikin Ashi
Le principal défi du trading Heikin Ashi est l’écart entre le prix moyenné du graphique et le prix de marché réel exécutable.
L’écart d’exécution est le risque central. Un graphique Heikin Ashi montre un haut de 1,0950, mais le bid-ask réel du marché à ce niveau peut être entièrement différent. Le « haut » HA est une moyenne calculée, pas une transaction. Lorsque les traders tentent de sortir au haut HA avec un ordre à cours limité, l’ordre peut ne jamais être exécuté car le marché réel s’est éloigné de ce prix théorique.
La gestion du retard consiste à utiliser l’action des prix brute pour l’exécution tout en utilisant Heikin Ashi pour la confirmation directionnelle. Un trader repère une forte tendance HA, mais place les stop loss et les entrées à l’aide du graphique en chandeliers standard, pas du graphique HA. Cette approche hybride capture la clarté visuelle du Heikin Ashi tout en évitant le piège de l’écart d’exécution.
La conscience du régime de marché révèle quand Heikin Ashi échoue complètement. Dans les marchés latéraux où les prix évoluent entre support et résistance sans tendance, les bougies Heikin Ashi font constamment des whipsaws. La formule de moyenne ne lisse pas l’action latérale, elle crée juste du bruit coloré. Les traders professionnels désactivent Heikin Ashi durant les périodes de range et s’appuient plutôt sur les chandeliers standards et les oscillateurs.
Combiner Heikin Ashi avec d’autres indicateurs pour une précision maximale
Intégrer Heikin Ashi avec des oscillateurs de momentum non lissés comme le RSI et des filtres de volume atténue le retard inhérent au processus de moyennage.
La divergence HA-RSI capture les retournements avant que les bougies HA ne changent de couleur. Le RSI (Relative Strength Index) n’est pas lissé, il répond immédiatement aux changements de momentum. Lorsqu’une forte tendance haussière HA affiche des bougies vertes, mais que le RSI commence à se retourner et à décliner, la divergence signale que le momentum s’essouffle. Le retournement apparaît d’abord dans le RSI, 1 à 2 bougies avant le changement de couleur du Heikin Ashi. Les traders professionnels utilisent cela comme alerte précoce pour resserrer les stops ou réduire la taille de position.
La confirmation par le volume garantit une forte participation sur les débuts de nouvelle tendance. Une bougie Heikin Ashi verte apparaissant sur un volume élevé confirme la participation institutionnelle. Une bougie verte sur faible volume pourrait n’être que du short-covering ou du bruit algorithmique. Ajouter un filtre de volume transforme Heikin Ashi d’un outil à 52 % de taux de réussite en un outil à plus de 60 %.
Transformez vos connaissances en profit
Vous avez lu, il est temps d’agir. La meilleure façon d’apprendre, c’est en pratiquant. Ouvrez un compte démo gratuit et sans risque et entraînez votre stratégie avec des fonds virtuels dès aujourd’hui.
Ouvrir un compte démo gratuitPoints clés
- Les bougies Heikin Ashi fournissent une représentation lissée de l’action des prix en moyennant les données de la bougie actuelle et précédente pour filtrer le bruit du marché.
- L’identification de tendance est la principale force du Heikin Ashi, les bougies vertes pleines signifiant un fort momentum haussier et les rouges pleines un momentum baissier.
- La formule Heikin Ashi garantit que chaque nouvelle bougie ouvre au point médian de la précédente, créant un flux continu et lisible.
- L’écart d’exécution désigne la différence entre le prix Heikin Ashi moyenné et le prix de marché réel, exigeant que les traders exécutent sur les graphiques bruts.
- Les rendements ajustés au risque sont généralement plus élevés avec les stratégies Heikin Ashi car l’effet de lissage réduit la fréquence des sorties prématurées en « whipsaw ».
- Combiner HA avec des indicateurs comme le RSI ou les moyennes mobiles est essentiel pour compenser le retard inhérent d’une bougie présent dans le processus de moyennage.
Foire aux questions
Cet article contient des références aux bougies Heikin Ashi et à Volity, une plateforme de trading de CFD réglementée. Ce contenu est produit à des fins éducatives uniquement et ne constitue pas un conseil financier ni une recommandation d’exécuter une stratégie de trading spécifique utilisant le graphique Heikin Ashi. Les graphiques Heikin Ashi affichent des prix moyennés qui diffèrent des prix de marché réels exécutables ; vérifiez toujours les règles d’exécution de votre courtier et utilisez les graphiques en chandeliers standards pour le placement d’ordres. Certains liens de cet article peuvent être des liens affiliés.