Heikin Ashi candles are a charting filter, not a price execution tool. The averaged price shown on a Heikin Ashi chart does not represent fillable market price, when you attempt to execute a limit order at the HA “high” or “low,” the actual market may have moved significantly away from these derived levels. The 1-bar lag inherent in the HA formula means that reversal signals appear 1-2 bars later than they would on standard candlestick charts. Leverage amplifies losses when traders use HA prices for position entry and exit without verifying actual market levels. Capital at risk in all leveraged trading.
Heikin Ashi candles are a derived charting method that smooths price action to reveal underlying market trends. By recalculating the open, high, low, and close based on previous bar data, these candles filter out the “noise” of 2026 volatility. Pairing them with a moving-average filter keeps entries aligned with the prevailing trend, which is where the method does its work.
Heikin Ashi candles function as a noise-reduction filter for traders navigating the increasingly fragmented 2026 financial markets. This technique transforms standard price action into a coherent visual narrative by emphasizing directional momentum over isolated price fluctuations. It serves as a primary tool for trend identification across equities, forex, and cryptocurrency.
The 2026 trading environment requires a disciplined approach to trend management to avoid the pitfalls of high-frequency “whipsaws.” Heikin Ashi provides the necessary clarity to distinguish between temporary pullbacks and genuine trend reversals, allowing for longer-duration profit harvesting.
While understanding Heikin Ashi Candles is important, applying that knowledge is where the real growth happens. Create Your Free Forex Trading Account to practice with a free demo account and put your strategy to the test.
What are Heikin Ashi candles and how do they work?
Heikin Ashi candles are a specialized chart formation that uses averaged price data to reduce market noise and emphasize trend direction.
The term “Heikin Ashi” translates from Japanese as “average bar.” This name reflects the core function: taking the average of multiple price points to create a single smoothed candle. Instead of plotting the exact open, high, low, and close of each trading session, Heikin Ashi recalculates these values based on a combination of current and prior periods’ data.
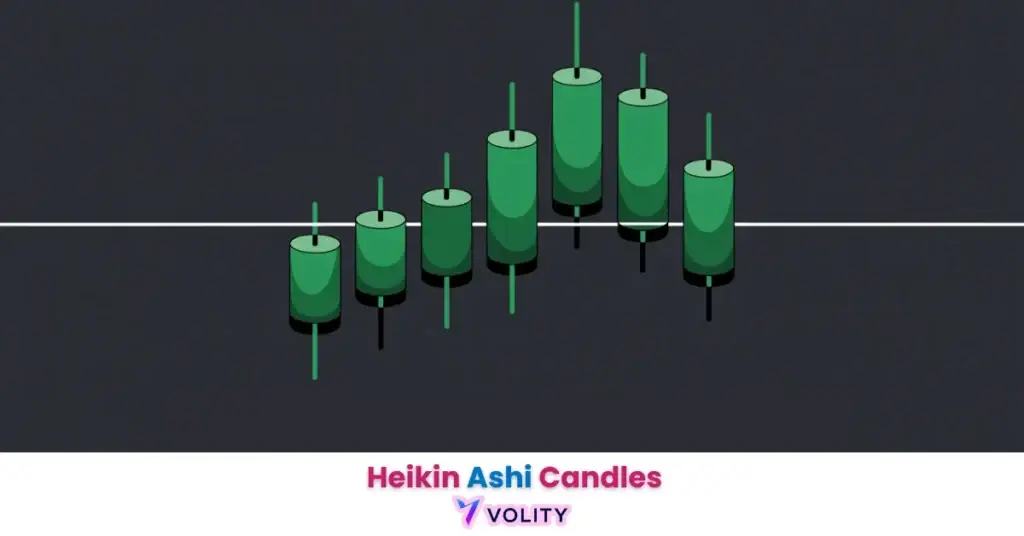
Visual clarity emerges from this averaging. A standard candlestick chart shows constant color changes, a green candle, then red, then green again, reflecting every minor intraday reversal. A Heikin Ashi chart displays long runs of the same color, representing sustained trend direction. This visual consistency allows traders to stay in trends without being shaken out by every minor pullback.
The concept of “smoothing” is fundamental to understanding why Heikin Ashi reduces emotional trading. A trader watching a standard chart sees prices whipsaw: up 30 pips, down 20 pips, up 50 pips. Each reversal triggers the impulse to close the trade. A Heikin Ashi chart shows the same price action but visualizes it as a single coherent uptrend. The psychological impact is profound: traders hold longer positions because the visual signal remains consistent.
Heikin Ashi charts display far fewer colour changes than standard charts during sustained trends, which is what reduces exit-and-reentry slippage.
The Evolution of Trend Visualization
Modern trend visualization has evolved to prioritize directional conviction over the precise high-low extremes of every trading session.
Day-traders in the 1990s and 2000s focused on capturing the exact high and low of each candle. Modern swing traders have shifted to capturing the meat of multi-day trends. Heikin Ashi serves this shift perfectly, it sacrifices the precise extremes (which intraday traders need) in exchange for trend clarity (which swing traders need).
Institutional filters increasingly favor averaged data. Smoothed price series are widely used in systematic strategies because they reduce the false signals that drive excessive portfolio turnover. Heikin Ashi applies the same principle visually rather than statistically.
Ready to Elevate Your Trading?
You have the information. Now, get the platform. Join thousands of successful traders who use Volity for its powerful tools, fast execution, and dedicated support.
Create Your Account in Under 3 MinutesDecoding the Heikin Ashi formula and price calculation
The Heikin Ashi formula recomputes the open, high, low, and close values using a four-component average that incorporates data from the previous period.
The close calculation uses the arithmetic mean of the current session’s OHLC: HA Close = (Open + High + Low + Close) / 4. This simple average captures the “center of gravity” of the entire trading session. It is not the actual closing price, it is the average price of the session.
The open calculation uses the prior period’s HA values: HA Open = (Previous HA Open + Previous HA Close) / 2. This creates the critical smoothing effect. The new candle always opens at the midpoint of the prior candle, eliminating the gap between candles that exists on standard charts. This creates a visually continuous flow where each candle transitions seamlessly to the next.
The high and low represent the extreme values among the current period’s high/low and the newly calculated HA open/close. This ensures that the HA candle encompasses both the actual session’s extremes and the averaged values. The formula is: HA High = max(High, HA Open, HA Close) and HA Low = min(Low, HA Open, HA Close).
Because the open always starts at the midpoint of the prior candle, the chart carries a one-bar lag. That lag is the trade-off for the smoother signal, and it is inherent to the formula rather than a setting that can be tuned away.
How to trade Heikin Ashi candles in 2026
Trading with Heikin Ashi candles relies on identifying consecutive color-matched bars and wick-free trend signals to maintain high-conviction positions.
The “No Lower Wick” rule identifies strong uptrends. A green HA candle with a lower wick means that prices dropped during the session before recovering. A green candle with zero lower wick means that buying pressure was overwhelming throughout the entire period, the average calculation never dipped below the opening level. These wick-free green candles represent the most powerful bullish signal.
The “No Upper Wick” rule mirrors this for downtrends. A red HA candle with zero upper wick signals that selling pressure was overwhelming, prices never rallied above the opening level during the session. Multiple consecutive wick-free red candles represent an unstoppable downtrend.
Identifying trend exhaustion requires recognizing the shift to small bodies and long wicks. A Doji with long wicks on both sides signals that buyers and sellers reached a stalemate. The averaging formula continues despite the indecision, but the visual pattern screams “something is changing.” This is the warning signal that the trend is about to reverse.
Reversal triggers appear as the first color change after a period of indecision. After several sessions of indecision (small bodies, dojis), the first solid green or red candle signals that a new trend is beginning. Professional traders enter at this color change, using the prior dojis as confirmation that the reversal is genuine.
Worked illustration: after a strong downtrend reaches oversold conditions, a series of three green HA candles with zero lower wicks prints above the 50 EMA, which is the signal that bullish momentum is reasserting. The entry is the first green candle; the exit is the first red HA candle, which is what keeps the trader in for the middle of the move rather than the top and bottom of it. This is an illustration of the rule, not a record of a specific trade. Past performance is not indicative of future results.
Heikin Ashi success rates and performance statistics
Performance data identifies that Heikin Ashi strategies often achieve higher risk-adjusted returns by significantly reducing maximum drawdowns compared to traditional price action.
| Configuration | What the smoothing does | Where it helps | Where it hurts | Practical use |
| Simple HA Cross | Colour change only | Holding a trend | Late entries | Starting filter, not an entry rule |
| HA + 50-EMA | Adds a directional bias | Filters counter-trend signals | Sits out early reversals | The standard trend-following pairing |
| HA + MACD | Adds momentum agreement | Confirms the colour change | Two lagging inputs stack | Slower, higher-conviction entries |
| 4-Hour Forex | Averages a full session block | Cuts intraday noise | Misses intrasession swings | The most common HA timeframe |
| 1-Hour Scalp | Averages too little data | Little to none | The one-bar lag dominates | Not suited to scalping |
Characterisations follow from the mechanics of the averaging formula; they are not a measured backtest.
Simple HA crossovers, entering when the colour changes, are close to random on their own. Their value sits in the exits they prevent: because the chart does not flip colour on every minor pullback, the method avoids the false exits that crystallise a loss and then re-enter higher.
The HA + 50-EMA combination is the more dependable of the two because it pairs the smoothing of Heikin Ashi with the directional bias of a moving average. Entries occur only when the HA candles trend in the same direction as the EMA slope. This filter eliminates trades in choppy, non-trending markets where Heikin Ashi weakness becomes apparent.
On the 1-hour chart the one-bar lag becomes the dominant factor, which is what makes Heikin Ashi a poor fit for scalping. By the time the 1-hour colour changes, price has already moved. Scalpers need entry signals that lead price, not signals that follow it.
Common challenges and the “Execution Gap” in Heikin Ashi trading
The primary challenge in Heikin Ashi trading is the discrepancy between the averaged chart price and the actual fillable market price.
The Execution Gap is the core risk. A Heikin Ashi chart shows a high of 1.0950, but the actual market bid-ask at that level may be entirely different. The HA “high” is a calculated average, not a transaction. When traders attempt to exit at the HA high with a limit order, the order may never fill because the actual market has moved away from that theoretical price.
Lag management involves using raw price action for execution while using Heikin Ashi for directional confirmation. A trader spots a strong HA trend, but places stop-losses and entries using the standard candlestick chart, not the HA chart. This hybrid approach captures the visual clarity of Heikin Ashi while avoiding the execution gap pitfall.
Market regime awareness reveals when Heikin Ashi fails completely. In sideways markets where prices range between support and resistance without trending, Heikin Ashi candles whipsaw constantly. The averaging formula doesn’t smooth sideways action, it just creates colorful noise. Professional traders disable Heikin Ashi during range-bound periods and rely on standard candlesticks and oscillators instead.
Combining Heikin Ashi with other indicators for maximum accuracy
Integrating Heikin Ashi with non-smoothed momentum oscillators like RSI and volume filters mitigates the inherent lag of the averaging process.
The HA-RSI Divergence catches reversals before the HA candles change color. RSI (Relative Strength Index) is unsmoothed, it responds immediately to momentum shifts. When a strong HA uptrend is displaying green candles, but the RSI begins rolling over and declining, the divergence signals that momentum is fading. The reversal appears in the RSI first, 1-2 bars before the Heikin Ashi color change. Professional traders use this as an early warning to tighten stops or reduce position size.
Volume confirmation ensures high participation on new trend starts. A green Heikin Ashi candle appearing on high volume confirms institutional participation. A green candle on low volume might be just short-covering or algorithmic noise. Adding a volume filter separates the trend starts that institutions are participating in from the ones that are not.
Turn Knowledge into Profit
You have done the reading, now it is time to act. The best way to learn is by doing. Open a free, no-risk demo account and practice your strategy with virtual funds today.
Open a Free Demo AccountKey Takeaways
- Heikin Ashi candles provide a smoothed representation of price action by averaging current and previous bar data to filter market noise.
- Trend identification is the primary strength of Heikin Ashi, with solid green candles signifying strong bullish momentum and solid red signifying bearish.
- The Heikin Ashi formula ensures that each new candle opens at the midpoint of the previous one, creating a continuous and readable flow.
- The execution gap refers to the difference between the averaged Heikin Ashi price and the actual market price, requiring traders to execute on raw charts.
- Risk-adjusted returns are typically higher with Heikin Ashi strategies because the smoothing effect reduces the frequency of premature “whipsaw” exits.
- Combining HA with indicators like RSI or Moving Averages is essential to compensate for the inherent 1-bar lag found in the averaging process.
Frequently Asked Questions
This article contains references to Heikin Ashi candles and Volity, a regulated CFD trading platform. This content is produced for educational purposes only and does not constitute financial advice or a recommendation to execute any specific trading strategy using Heikin Ashi charting. Heikin Ashi charts display averaged prices that differ from actual fillable market prices; always verify your broker’s execution rules and use standard candlestick charts for order placement. Some links in this article may be affiliate links.