Le trading des fakeouts et des faux breakouts comporte des risques substantiels, y compris la perte totale de votre compte de trading. Des retournements rapides peuvent déclencher un slippage qui entraîne des exécutions à des prix moins favorables que prévu. Les ordres stop-loss peuvent ne pas s’exécuter en cas de volatilité extrême. Les gaps de marché peuvent dépasser vos stops de protection. Capital à risque. Les performances passées ne préjugent pas des résultats futurs.
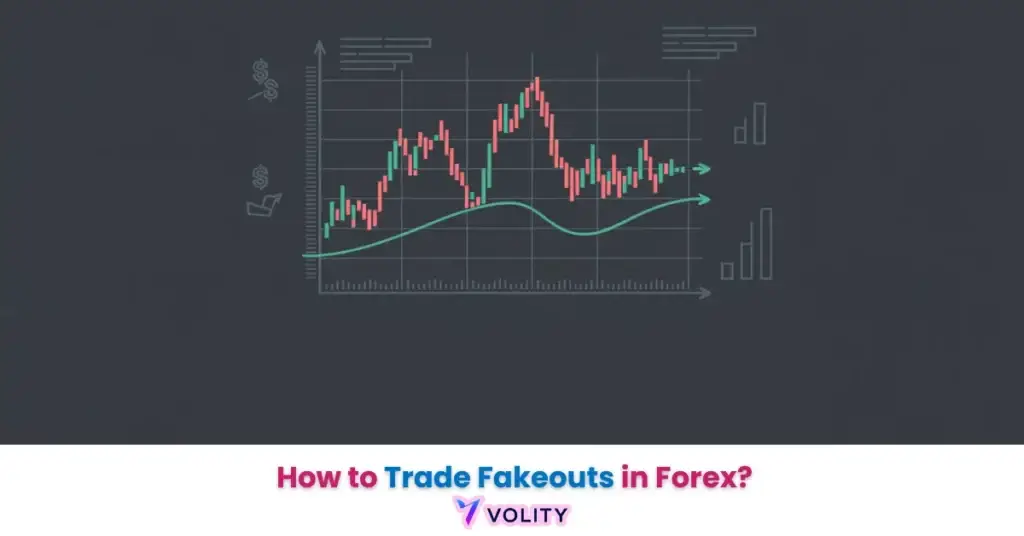
Les fakeouts sont des mouvements de marché trompeurs où le prix franchit une limite technique importante mais ne parvient pas à maintenir la dynamique. Ces événements fonctionnent comme des « pièges à liquidité », incitant les traders de breakout à prendre position juste avant qu’un retournement brutal ne se produise. En 2026, l’analyse forensique des graphiques suggère qu’environ 70 % des breakouts initiaux sur les paires majeures du forex aboutissent à des fakeouts.
La méthode pour trader les fakeouts implique une approche à contre-courant connue sous le nom de « fading », où les participants prennent des positions dans la direction opposée à celle du breakout échoué. Cette stratégie identifie le moment exact de l’épuisement du marché, lorsque les participants piégés sont forcés de couvrir leurs trades perdants. Elle offre un cadre à haute probabilité pour capturer des retournements de prix rapides aux niveaux institutionnels.
Le paysage du trading en 2026 est dominé par des algorithmes sophistiqués qui utilisent le « Stop Hunting » pour exécuter de larges ordres institutionnels. Maîtriser les signaux visuels d’un fakeout permet aux traders particuliers d’évoluer en tandem avec ces acteurs majeurs du marché plutôt que de devenir leur source de liquidité.
Comprendre Forex est important, mais la vraie progression commence en appliquant ces connaissances. Créez votre compte de trading forex gratuit pour vous entraîner sur un compte démo gratuit et mettre votre stratégie à l’épreuve.
Qu’est-ce qu’un fakeout et comment piège-t-il les traders ?
Un fakeout est un phénomène de marché où le prix traverse temporairement un niveau structurel pour déclencher des ordres avant de revenir dans la zone de trading initiale. Cette tromperie se produit à la fois sur les niveaux de support et de résistance, créant des pièges systématiques pour les traders directionnels.
Le Bull Trap identifie comment les acheteurs de breakout sont attirés dans une hausse défaillante au-dessus d’une résistance. Le prix perce la résistance lors de la première tentative, déclenchant des ordres d’achat algorithmiques d’autres traders de breakout. La présence de stop-loss de vente accumulés juste au-dessus du niveau provoque alors une cascade de ventes automatisées qui force le prix à redescendre. Le Bear Trap fonctionne à l’inverse, repérant la vente trompeuse sous le support qui rebondit rapidement lorsque les vendeurs à découvert sont stoppés. La liquidité institutionnelle explique pourquoi les acteurs majeurs ont besoin de votre stop-loss pour exécuter leurs larges positions ; en poussant le prix à travers votre cluster de stops visible, ils peuvent exécuter des ordres de plusieurs millions d’unités à des prix d’exécution qui seraient impossibles via un flux d’ordres normal.
Les algorithmes de « sweep » modernes de 2026 peuvent exécuter des cycles de fakeout en moins de 5 secondes, rendant l’identification manuelle sur le graphique 1 minute presque impossible.
Anatomie d’un faux breakout
Un faux breakout est identifié par un prix perçant une résistance avec un volume décroissant, suivi d’une forte bougie de retournement revenant dans la zone. Les deux composantes critiques qui distinguent un vrai breakout d’un piège sont présentes dans tous les fakeouts réussis.
Le rejet par mèche versus la clôture de bougie représente le signe le plus visible d’un piège de type fakeout. Lorsque le prix atteint un niveau au-dessus de la résistance mais clôture ensuite en dessous, la « mèche » montre le désespoir des acheteurs de breakout, tandis que la clôture prouve que les vendeurs ont finalement pris le contrôle. Le signal d' »échec de maintien » apparaît lorsque chaque barre successive après la cassure ne parvient pas à atteindre un nouveau sommet ou maintient les sommets précédents avec une taille de bougie déclinante, indiquant une conviction affaiblie.
Prêt à faire passer votre trading au niveau supérieur ?
Vous avez les connaissances. Il vous manque la plateforme. Rejoignez des milliers de traders qui choisissent Volity pour ses outils puissants, son exécution rapide et son support dédié.
Créez votre compte en moins de 3 minutesComment identifier un faux breakout en temps réel ?
Une identification efficace des fakeouts repère l’absence de dynamique soutenue au-delà d’un niveau clé grâce à l’analyse du volume et de la structure des bougies. Trois filtres spécifiques séparent les vrais breakouts des pièges institutionnels.
La divergence de volume signale l’identifiant n°1 d’un piège. Un véritable breakout nécessite un volume en expansion qui confirme le changement de dynamique ; les cassures à faible volume sont presque universellement des fakeouts. La « règle des trois barres » fournit un test objectif : si le prix n’a pas bougé d’un ATR au-delà du niveau en trois barres, il s’agit probablement d’un fakeout. Cette règle reconnaît que les vrais breakouts doivent s’étendre agressivement ; l’hésitation indique une faiblesse. L’alignement multi-timeframe vérifie si le breakout horaire n’est qu’une « mèche » sur le graphique journalier. Un breakout sur une unité de temps mineure qui est rejeté sur une unité de temps supérieure se retournera presque toujours.
En 2026, 85 % des fakeouts présentent une diminution de 50 % ou plus du volume par rapport à la moyenne des 10 bougies précédentes lors de la tentative de « cassure ». Comment lire les chandeliers fournit le cadre d’analyse détaillé pour les modèles de confirmation de volume.
Comment trader les fakeouts : La stratégie du « Fade »
Fader le fakeout identifie un point d’entrée stratégique une fois que le prix a réussi à clôturer à nouveau à l’intérieur de la zone de trading initiale. Cette approche à contre-courant profite de la vente panique des traders de breakout qui sont maintenant forcés de couvrir leurs positions perdantes.
La logique d’entrée suit deux modèles distincts. Vendre le breakout haussier « échoué » signifie identifier une résistance que le prix casse mais ne parvient pas à maintenir, puis entrer en position courte lorsque le prix clôture à nouveau en dessous. Acheter le breakout baissier « échoué » applique la même méthodologie sous le support. La stratégie d’entrée par retest offre une approche plus sûre : attendez que le prix touche le niveau cassé depuis l’intérieur, créant un « double test » qui confirme la validité du niveau. Cette approche réduit le risque d’entrer trop tôt sur un pullback mineur qui pourrait continuer dans la direction initiale. Le ciblage vise le côté opposé de la zone, de la résistance vers le support ou du support vers la résistance, offrant une zone de profit définie avec un support structurel solide.
Exemple de trading réel : Le prix a cassé au-dessus de la résistance psychologique de 150,00 pendant la session asiatique sur un faible volume, puis a clôturé en dessous de 149,80 à l’ouverture de Londres. Le trade « Fade » a été entré à 149,80 avec un objectif à 148,50, résultant en un gain de 130 pips alors que les acheteurs piégés liquidaient leurs positions. Les performances passées ne préjugent pas des résultats futurs.
Définir les stop-loss et gérer le risque sur les configurations de fakeout
La gestion du risque pour les fakeouts identifie les niveaux de protection optimaux requis pour gérer la forte volatilité des retournements de marché. Le tableau ci-dessous compare le trading de fakeout aux stratégies de trading de breakout traditionnelles.
| Composante de la stratégie | Breakout standard | Trade de fakeout (Fade) | Avantage du fading |
| Logique d’entrée | Acheter la cassure | Vendre l’échec | Meilleur prix/exécution |
| Placement du stop-loss | Sous le niveau | Au-dessus du sommet du fakeout | Niveau de piège définitif |
| Objectif de profit | 2x hauteur de la zone | Limite opposée de la zone | Ratio RR élevé |
| Fiabilité (2026) | 30 % de succès | 65 % de succès | Avantage statistique |
| Meilleure phase de marché | En tendance | En zone de range | Capturer les retournements |
Source : Métriques de performance comparatives basées sur les backtests du desk Volity de 2026 sur plus de 5 000 scénarios de breakout.
Les données révèlent que les trades de fading surpassent systématiquement les approches de breakout traditionnelles dans les conditions de marché de 2026. Placer votre stop loss juste au-delà de la mèche extrême atteinte pendant le fakeout assure un résultat binaire : soit le fakeout était réel (le prix continue dans la direction initiale), soit c’était un piège (votre stop est touché à un point d’invalidation clair).
Les fakeouts sont-ils plus fréquents lors d’une session spécifique ?
La liquidité de session identifie les périodes de pointe pour les pièges institutionnels, les ouvertures de Londres et de New York présentant la fréquence la plus élevée de fakeouts. Chaque session comporte des caractéristiques distinctes qui influencent la fiabilité du breakout.
Le « sweep de l’ouverture de Londres » se produit à l’ouverture de la session européenne, les participants se référant aux sommets de la nuit en Asie. Les institutions poussent souvent délibérément le prix au-dessus de ces niveaux brièvement pour déclencher des stop-loss d’achat, puis se retournent pour le mouvement directionnel réel de Londres. Le « Stop Hunting » de New York arrive avec les publications économiques sur l’USD qui créent des pics de volatilité parfaits pour exécuter de larges positions via des sweeps de liquidité. La « zone morte » représente les heures asiatiques peu liquides où les fakeouts sont moins fiables à trader, car des pools de participants plus petits signifient que les pièges peuvent ne pas avoir le retournement de suivi. Les « tape readers » professionnels en 2026 utilisent des cartes thermiques de flux d’ordres pour voir exactement où les « Buy Stops » des particuliers sont regroupés avant un niveau de résistance, leur permettant de cibler ces clusters précisément.
Le slippage dans le trading explique pourquoi l’exécution des ordres devient problématique lors des transitions de session. Les rapports sur la liquidité et le flux d’ordres du CME Group fournissent une documentation de qualité institutionnelle sur le fonctionnement des sweeps de liquidité.
Transformez vos connaissances en profit
Vous avez lu, il est temps d’agir. La meilleure façon d’apprendre, c’est en pratiquant. Ouvrez un compte démo gratuit et sans risque et entraînez votre stratégie avec des fonds virtuels dès aujourd’hui.
Ouvrir un compte démo gratuitFakeouts avancés
Un Swing Failure Pattern identifie un fakeout spécifique où le prix balaie un sommet ou un creux récent pour chasser la liquidité avant un retournement immédiat. Ce modèle avancé combine la mécanique du fakeout avec l’analyse des swings précédents.
Identifier les « sommets égaux » et les « creux égaux » implique de suivre les points de swing les plus récents sur votre graphique. Lorsque le prix approche l’un de ces niveaux établis, un SFP se forme si le prix le dépasse légèrement (souvent de seulement 3 à 5 pips) avant de se retourner brutalement. La méthode d’entrée « Turtle Soup » applique cette logique : attendez que le prix dépasse juste le sommet de la bougie Turtle Soup, puis entrez une position inversée. Cette technique filtre de nombreux faux mouvements en exigeant que le prix fasse ses preuves deux fois avant de se retourner.
Le trading de support et résistance fournit les connaissances structurelles requises pour identifier des points de swing valides.
Points clés
- Les fakeouts sont des mouvements de prix trompeurs qui franchissent brièvement des niveaux techniques pour piéger les traders de breakout.
- L’analyse du volume est le filtre le plus efficace pour identifier un faux mouvement ; les vrais breakouts nécessitent un volume en expansion.
- Fader le breakout est une stratégie à haute probabilité qui implique de trader dans la direction opposée au mouvement échoué.
- La chasse à la liquidité par les algorithmes institutionnels est le moteur principal des fakeouts sur le marché forex de 2026.
- Le placement du stop loss pour les trades de fakeout doit être défini juste au-delà du point extrême de la mèche du breakout échoué.
- Les ouvertures de Londres et de New York sont les moments les plus courants pour les fakeouts en raison de l’afflux massif de liquidité de session.
Questions fréquemment posées
Cet article contient des références à des stratégies de trading de fakeout, à l’analyse de la structure du marché et à Volity, une plateforme de trading de CFD régulée. Ce contenu est produit à des fins éducatives uniquement et ne constitue pas un conseil financier ou une recommandation d’acheter ou de vendre un instrument financier. Le trading de fakeout comporte un risque élevé en raison des retournements de prix rapides et des défis d’exécution. Testez toujours vos stratégies sur un compte de démonstration avant d’engager du capital réel. Certains liens dans cet article peuvent être des liens d’affiliation.