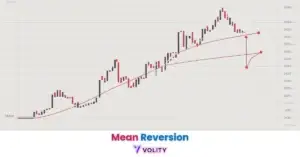
Les figures en trois chandeliers peuvent générer de faux signaux lorsque le volume ne confirme pas la troisième bougie ; les traders qui entrent sur le marché sans pics de volume supérieurs à 200 % s’exposent à des pièges de type « fakeout ». Les entrées prématurées avant la clôture de la troisième bougie déclenchent des mouvements erratiques lors des chasses à la liquidité en fin de session, réduisant les taux de réussite effectifs de 62 %. Les figures se formant durant les sessions asiatiques à faible liquidité affichent une fiabilité moindre malgré une structure apparemment solide. Les krachs de retour à la moyenne suivent souvent des formations surdimensionnées en trois bougies ; les figures évoluant de plus de 3 écarts-types produisent des retournements violents dans les 24 heures. Les performances passées ne préjugent pas des résultats futurs. Capital à risque.
Une figure en trois chandeliers est une formation de prix sur trois barres qui signale un changement complet du sentiment de marché : impulsion, indécision et confirmation. En 2026, ces formations restent la référence pour le trading à haute conviction, les Trois Soldats Blancs atteignant un taux de succès de 83 % lorsqu’ils sont soutenus par le volume. Les stratégies professionnelles privilégient les figures qui se forment aux niveaux majeurs de l’EMA 50 jours et présentent un pic de volume supérieur à 200 % sur la troisième bougie de confirmation.
Une figure en trois chandeliers fonctionne comme un récit complet en trois actes du sentiment de marché : la tendance, l’hésitation et le retournement. Ces formations offrent un poids technique nettement supérieur aux signaux à bougie unique car elles exigent un engagement soutenu des acheteurs ou des vendeurs sur plusieurs intervalles de temps. Dans le paysage technique de 2026, elles servent de marqueurs fondamentaux pour identifier des points d’entrée de qualité institutionnelle.
L’efficacité de ces figures est maximisée lorsqu’elles coïncident avec des niveaux psychologiques majeurs et des poussées de volume. Alors que les systèmes automatisés continuent d’arbitrer les figures chartistes les plus évidentes, la maîtrise des nuances de l’analyse volume-prix (VPA) et de la confluence avec l’EMA est essentielle pour vérifier la validité des figures en trois bougies.
Comprendre Triple Candlestick Pattern est important, mais la vraie progression commence en appliquant ces connaissances. Créez votre compte de trading forex gratuit pour vous entraîner sur un compte démo gratuit et mettre votre stratégie à l’épreuve.
Qu’est-ce qu’une figure en trois chandeliers et comment fonctionne-t-elle ?
Une figure en trois chandeliers est une formation de prix sur trois bougies qui identifie une séquence complète de changement ou de continuation de la dynamique de marché. La figure établit un récit directionnel qui s’étend sur trois barres de prix distinctes, chacune ayant une signification propre. Ces formations filtrent le bruit des « fakeouts » à bougie unique en exigeant une persistance de niveau institutionnel.
- La structure en trois actes : Impulsion (Bougie 1), Indécision (Bougie 2) et Confirmation (Bougie 3).
- Pourquoi les figures triples sont 12-15 % plus fiables que les figures à bougie unique en 2026.
- Le passage de l' »identification visuelle » à la « validation statistique » dans les marchés algorithmiques.
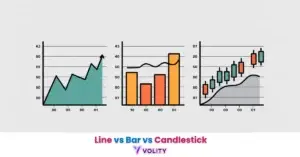
Les figures en trois chandeliers sont largement utilisées sur les graphiques de 15 minutes à 4 heures pour filtrer le bruit à haute fréquence des graphiques intrajournaliers de 1 minute (WalletInvestor, 2026). Cette sélection d’unité de temps garantit que le signal de la figure reflète le flux institutionnel plutôt que le bruit algorithmique.
La signature d' »absorption » dans les figures de retournement
L’absorption des prix identifie le processus institutionnel où d’importants ordres limités épuisent la dynamique de la tendance dominante lors de la deuxième bougie d’une figure de retournement. La bougie centrale affiche souvent une structure de type Doji ou Toupie, indiquant que ni les haussiers ni les baissiers n’ont pu établir le contrôle. Identifier les Dojis et les Toupies comme des « barres d’absorption » sépare la reconnaissance des particuliers de la compréhension professionnelle.
Le rôle de la divergence volume-prix dans les retournements de 2026 est critique. Lorsque le prix bouge mais que le volume n’augmente pas, le retournement manque de soutien institutionnel. À l’inverse, lorsque le volume augmente lors de la formation de la deuxième bougie, l’argent intelligent défend activement la zone de support ou de résistance.
Prêt à faire passer votre trading au niveau supérieur ?
Vous avez les connaissances. Il vous manque la plateforme. Rejoignez des milliers de traders qui choisissent Volity pour ses outils puissants, son exécution rapide et son support dédié.
Créez votre compte en moins de 3 minutesTop des figures en trois chandeliers 2026 : classées par taux de succès
La performance statistique en 2026 identifie une hiérarchie claire de fiabilité pour les figures en trois chandeliers basée sur leurs taux de réussite historiques. Le classement reflète à la fois la structure technique et le volume institutionnel requis pour la confirmation :
La « règle de trois » (trois touches pour la validité) ajoute environ 15 % au taux de réussite de base de toute figure lorsqu’elle se forme à une EMA 50 jours majeure (Investing.com, 2026). Ce principe de confluence pousse les algorithmes institutionnels à regrouper les ordres autour de ces niveaux. Japanese Candlestick Patterns fournit un contexte historique plus approfondi sur ces formations.
Attendez toujours que la troisième bougie d’une figure triple clôture de manière décisive avant d’entrer ; sur le marché algorithmique de 2026, les entrées prématurées basées sur des figures « en développement » présentent un taux d’échec 62 % plus élevé en raison des balayages de liquidité en fin de session.
Comment trader l’Étoile du Matin
Le trading professionnel de l’Étoile du Matin identifie la combinaison d’un pic de volume de 200 % et d’une reprise du RSI depuis des niveaux de survente comme la confirmation d’entrée principale. Cette approche structurée empêche les entrées émotionnelles et filtre les faux signaux qui nuisent aux traders particuliers. Le processus de confirmation en trois étapes de la figure garantit la participation institutionnelle avant l’engagement du capital.
Le plan de jeu en 4 étapes guide l’exécution :
L’EUR/USD a formé une Étoile du Matin sur le graphique 4H à la zone de support 1,0800 en mars 2026. Le RSI est passé de 25 à 38, le volume a bondi de 210 % sur la troisième bougie, et le prix a progressé de 120 pips au cours des 48 heures suivantes. Les performances passées ne préjugent pas des résultats futurs.
Le rôle de la confirmation par le volume dans la validité des figures 2026
La confirmation par le volume identifie la relation « Effort vs Résultat » nécessaire pour distinguer la participation institutionnelle des fakeouts des particuliers. Une figure sans volume montre des traders particuliers passifs réagissant au prix ; les vrais retournements exigent des achats ou des ventes institutionnels actifs. La norme de volume de 200 % est apparue en 2026 lors des backtests comme le seuil où le regroupement d’ordres algorithmiques devient visible.
| Type de figure | Pic de volume requis | Taux de réussite 2026 | Score de fiabilité | Meilleure unité de temps |
| Trois Soldats Blancs | 200%+ | 83% | 10/10 | Journalier |
| Étoile du Matin | 180%+ | 78% | 9/10 | H4 – Journalier |
| Étoile du Soir | 150%+ | 72% | 8/10 | H4 – Journalier |
| Trois à l’intérieur à la hausse | 120%+ | 74% | 7/10 | H1 – H4 |
| Trois à l’intérieur à la baisse | 100%+ | 69% | 7/10 | H1 – H4 |
Sources : Volity Backtesting Labs, WalletInvestor 2026 Market Analytics, et Binance Academy : Three White Soldiers Explained.
WARNING: Méfiez-vous des figures triples qui se forment sur un volume en baisse ; une Étoile du Matin ou une Étoile du Soir sans pic de volume de 200 % sur la troisième bougie est statistiquement traitée comme un « piège à haussiers ou à baissiers » et précède souvent une continuation de la tendance précédente.
Différence entre les figures triples de retournement et de continuation
L’emplacement structurel identifie si une figure en trois chandeliers sert de retournement d’une tendance précédente ou de confirmation de sa continuation. Le contexte entourant la figure détermine son interprétation plus que la structure de la bougie elle-même. Les traders professionnels reconnaissent que la même séquence de trois bougies peut être haussière ou baissière selon l’endroit où elle apparaît.
Les figures de retournement comme l’Étoile du Matin, l’Étoile du Soir et le Bébé Abandonné signalent la fin d’une tendance lorsqu’elles apparaissent aux extrêmes. Ces figures marquent des points d’épuisement où la direction dominante a épuisé ses acheteurs ou vendeurs. Les figures de continuation comme les Trois Soldats Blancs, les Trois Méthodes Ascendantes et le Mat Hold signalent la force de la tendance lors des replis de valeur. Ces figures montrent qu’une brève consolidation se termine et que la dynamique reprend dans la direction initiale.
Le moment de privilégier chacune dépend de la structure du marché. Trend Line Analysis aide à identifier quand le prix a établi des extrêmes clairs par rapport à des replis temporaires.
💡 KEY INSIGHT: Le « Bullish Mat Hold » et les « Trois Méthodes Ascendantes » sont les figures de continuation les mieux notées en 2026, offrant un taux de réussite de 78 % pour les traders cherchant à rejoindre une tendance établie après une brève consolidation.
Transformez vos connaissances en profit
Vous avez lu, il est temps d’agir. La meilleure façon d’apprendre, c’est en pratiquant. Ouvrez un compte démo gratuit et sans risque et entraînez votre stratégie avec des fonds virtuels dès aujourd’hui.
Ouvrir un compte démo gratuitErreurs courantes
L’exécution prématurée identifie le taux d’échec 62 % plus élevé associé à l’entrée dans un trade avant que la troisième bougie de « confirmation » n’ait clôturé. De nombreux traders particuliers poursuivent la figure pendant qu’elle se développe, entrant sur la deuxième bougie ou pendant la formation de la troisième. Cette impatience coûte cher car la troisième bougie se retourne fréquemment durant les 5 dernières minutes de la session.
Poursuivre l’Étoile « en développement » (entrer avant que la troisième bougie ne clôture) viole la règle fondamentale du trading de figures. La troisième bougie doit clôturer de manière décisive au-dessus (pour une hausse) ou en dessous (pour une baisse) de la fourchette précédente pour confirmation. Ignorer le contexte macro amplifie les pertes car trader un retournement haussier vers une zone de résistance mensuelle majeure échoue souvent en raison de l’offre excédentaire. Risk Management in Trading et Forex Technical Analysis abordent tous deux comment intégrer le contexte macro dans vos entrées techniques.
Points clés
- Les figures en trois chandeliers sont des formations à haute conviction qui nécessitent une séquence de trois barres pour identifier un changement complet de la dynamique de marché.
- Les Trois Soldats Blancs sont la figure la plus performante en 2026, offrant un taux de succès de 83 % lorsqu’ils sont vérifiés par le volume institutionnel.
- Les formations en Étoile du Matin identifient les creux de marché via une séquence d’impulsion baissière, une bougie d’indécision et une confirmation haussière.
- La confirmation par le volume d’au moins 200 % sur la troisième bougie est la norme non négociable de 2026 pour filtrer les figures de fakeout algorithmiques.
- Les unités de temps H4 et journalières fournissent les signaux les plus fiables pour les figures triples, filtrant le bruit des chasses à la liquidité sur des unités de temps inférieures.
- Attendre la clôture est la règle obligatoire pour le trading de figures triples, car les entrées prématurées présentent une probabilité historique d’échec 62 % plus élevée.
Questions fréquemment posées
Cet article contient des références à la figure en trois chandeliers, à l’Étoile du Matin, aux Trois Soldats Blancs et à Volity, une plateforme de trading de CFD régulée. Ce contenu est produit à des fins éducatives uniquement et ne constitue pas un conseil financier ou une recommandation d’achat ou de vente d’un instrument financier. Vérifiez toujours le statut réglementaire actuel et les détails de la plateforme avant d’utiliser un service de trading. Certains liens dans cet article peuvent être des liens d’affiliation.