Quick answer
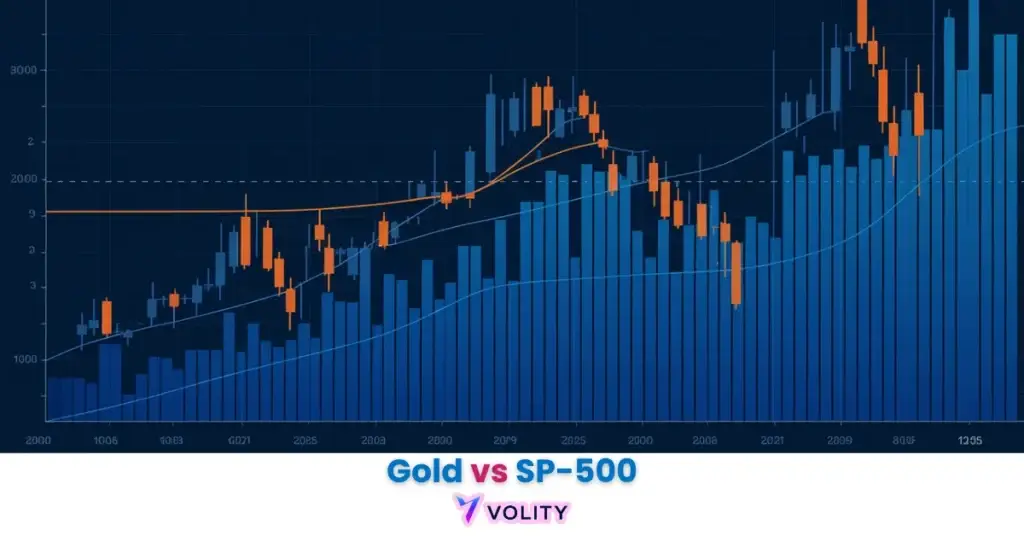
Gold vs the S&P 500: gold is a defensive store of value that often holds up or rises when stocks fall, while the S&P 500 tracks US equities and tends to grow more over the long run with higher volatility. Many investors hold both, using gold to diversify and hedge equity risk. Their correlation shifts with the economic cycle.
Gold and equity investments carry different risk profiles. Market performance is volatile and past returns do not guarantee future results. Portfolio diversification between gold and stocks does not eliminate risk. Central bank policy changes, geopolitical events, and liquidity crises can cause both assets to decline sharply. The S&P 500 is subject to corporate earnings risk and valuation cycles. Gold is subject to interest rate changes and USD strength fluctuations. Always consult a financial advisor before making asset allocation decisions. Capital at risk.
Gold and the S&P 500 represent the two primary pillars of a balanced multi-asset portfolio, serving as a safe-haven hedge and a growth engine, respectively. In 2025, gold delivered an extraordinary 63.8% return, significantly outperforming the S&P 500’s 18.2% gain. As of May 2026, the S&P-to-gold ratio sits at 1.57, reflecting a defensive market regime where investors are prioritizing tangible wealth preservation over traditional equity earnings.
Gold vs. S&P 500 functions as the ultimate barometer for global market sentiment and risk tolerance. This comparison identifies the relative strength of productive corporate earnings against the intrinsic security of tangible, non-yielding bullion. It serves as a foundational metric for constructing resilient portfolios in the 2026 inflationary landscape.
The 2026 investment landscape is defined by a “late-cycle” transition where commodities typically outperform traditional equity indices. Traders utilize these shifting performance gaps to optimize their asset allocation and to preserve purchasing power against a record $38 trillion in US sovereign debt.
While understanding Gold vs S&P 500 is important, applying that knowledge is where the real growth happens. Create Your Free Forex Trading Account to practice with a free demo account and put your strategy to the test.
What are the primary differences between gold and the S&P 500?
The S&P 500 is a market-cap weighted index of 500 leading US companies, whereas gold is a tangible commodity valued as a store of wealth. Growth through corporate earnings and dividends (equities) contrasts sharply with wealth preservation through scarcity (gold). The “AI 11” technology stocks have driven recent S&P 500 resilience, accounting for more than 40% of index gains in 2026. Gold functions as the “only financial asset without counterparty risk” in 2026, no issuer, no bankruptcy risk, no dilution through new share issuance.
Over the last 5 years (2021-2026), gold has returned approximately 157%, while the S&P 500 has returned roughly 78% according to VT Markets (2026). This performance gap reflects gold’s dominance during inflationary regimes while equities struggled with rising discount rates and shrinking profit margins.
The Power of Compounding vs. Scarcity
Compounding is the process of generating earnings on an asset’s reinvested earnings, which serves as the primary growth engine for the S&P 500. Total return (dividends reinvested) over decades produces exponential wealth growth, whereas gold’s returns depend solely on price appreciation. A $10,000 investment in the S&P 500 in 2000 compounds to approximately $67,000 by 2026 with dividends reinvested, yet the same $10,000 in gold grows primarily through revaluation rather than productivity gains.
Ready to Elevate Your Trading?
You have the information. Now, get the platform. Join thousands of successful traders who use Volity for its powerful tools, fast execution, and dedicated support.
Create Your Account in Under 3 MinutesWhy is gold beating the stock market in 2026?
Geopolitical risk and monetary policy uncertainty are the primary drivers enabling gold to outperform the S&P 500 in the first half of 2026. The “Strait of Hormuz Fear Premium” has elevated energy prices, which increases input costs for S&P 500 companies and reduces real earnings growth. The 3.8% US headline inflation rate erodes the purchasing power of fixed-income securities and compresses equity valuations, creating a favorable environment for inflation-protected tangible assets like gold.
Central bank de-dollarization serves as a “permanent bid” that supports gold during equity pullbacks. China, India, and emerging market central banks have accumulated 800 tonnes of gold in the first quarter of 2026 alone, establishing a structural floor under prices. In 2025, gold crushed the S&P 500 with a 63.8% return compared to the index’s 18.2% total return according to Visual Capitalist (2026).
The Spot Gold Price reflects this institutional demand, with daily trading volumes exceeding $250 billion globally. Understanding the drivers of gold’s outperformance, central bank demand, real yield compression, geopolitical risk, is essential for tactical allocation decisions in 2026.
What does the S&P 500 to gold ratio tell us in 2026?
The S&P 500 to gold ratio identifies the numerical relationship between equity valuations and the price of bullion to signal broader market cycles. Calculated by dividing the S&P 500 index level by the gold price per ounce, the current 1.57 ratio (7,390 S&P ÷ $4,700 Gold) as of May 12, 2026 represents a decline from the 1.66 ratio seen in late 2025, illustrating gold’s relative strength. A falling ratio typically indicates a “flight to safety” and defensive rotation by institutions toward commodity positions.
Historically, ratios below 1.50 preceded the 1970s stagflation period and again preceded the 2008 financial crisis. The 2026 ratio of 1.57 is approaching these warning levels, suggesting institutional conviction in defensive positioning. Real trading example: An investor increased gold weight by 10% in January 2026 when the ratio dropped below 1.60, then captured gold’s 9.3% YTD gain while avoiding the S&P 500’s volatile 7% Q1 drawdown. Past performance is not indicative of future results.
Sharpe Ratio Comparison: Risk-Adjusted Returns for 2026
Risk-adjusted return benchmarks identifies the efficiency of gold versus equities when accounting for the extreme volatility of the 2026 regime. The Sharpe ratio measures returns per unit of risk, higher ratios indicate smoother, more predictable performance.
| Metric | Gold (Spot) | S&P 500 (Total Return) | Source |
| 2025 Full Year | +63.8% | +18.2% | Visual Capitalist |
| 2026 YTD Return | +9.3% | +8.7% | VT Markets |
| Max Drawdown (2026) | -16% (Q1) | -7% (Q1) | SSGA |
| Sharpe Ratio (Long-term) | 0.51 | 0.67 | Curvo |
| Current Yield | 0.00% | 1.25% | Investing.com |
Source: 2026 data as of May 12 settlement. Sharpe ratios reflect 1992-2026 averages.
While equities show a higher long-term Sharpe ratio of 0.67 versus gold’s 0.51, this comparison masks the extraordinary volatility of 2026. Gold’s drawdown of 16% in Q1 2026 was significant, yet the S&P 500’s 7% drawdown combined with its higher volatility creates similar risk-adjusted returns when measured over shorter periods.
Portfolio Strategy: What is the best allocation for gold and stocks?
Strategic asset allocation represents the process of combining gold and equities to minimize portfolio drawdowns while maximizing long-term wealth. The “10% Rule” has traditionally suggested a 10% gold allocation for diversification, but 2026 analysts are bumping this to 15% due to rising debt risks. A gold allocation of 10% to 15% is recommended by 2026 analysts to buffer against the volatility of tech-heavy equity portfolios.
Gold’s role differs in a 60/40 portfolio (traditionally 60% equities/40% bonds) versus a tech-heavy growth portfolio weighted 80% toward mega-cap tech. In the latter case, gold becomes crucial, the portfolio’s correlation to inflation and geopolitical risk requires an uncorrelated hedge. The “Warsh Factor” (Federal Reserve policy shifts following Kevin Warsh’s nomination) impacts the equity risk premium and the “hurdle rate” investors demand before adding stocks to a gold-heavy portfolio.
In 2026, holding a 10% gold overlay has improved the Sharpe ratio of standard USD portfolios by 14% compared to an equity-only strategy. The Gold Trading for Beginners framework emphasizes that diversification is not about diluting returns, it is about capturing positive returns with lower peak-to-trough drawdowns.
Turn Knowledge into Profit
You have done the reading, now it is time to act. The best way to learn is by doing. Open a free, no-risk demo account and practice your strategy with virtual funds today.
Open a Free Demo AccountThe Future of the Gold-Equity Correlation
Decoupling identifies the breakdown of traditional market correlations where both gold and stocks rise simultaneously due to excessive liquidity. Gold and the S&P 500 both returned approximately 9% YTD in 2026 despite hawkish Federal Reserve signals, an outcome that contradicts the historical inverse relationship between equities and gold. This decoupling reflects the unusual 2026 environment where record debt levels and central bank de-dollarization create a permanent structural bid under gold, while corporate earnings (driven by AI) remain strong enough to support equities.
The role of “Digital Gold” (Bitcoin) in shifting the flows between traditional risk and safe-haven assets further complicates the correlation picture. As Bitcoin captures some flight-to-safety demand that previously flowed to gold, the historical gold-equity relationship becomes less predictable. Understanding this future dynamic, where gold, equities, and cryptocurrencies all bid higher simultaneously, is essential for portfolio managers in 2026.
The Safe Haven Asset classification of gold remains valid only as long as Central Bank Policy supports money supply expansion. Once rates normalize in 2027 or beyond, the correlation between gold and equities may revert to historical patterns, creating a crucial decision point for allocators holding defensive positions.
Key Takeaways
- [Gold] delivered a massive 63.8% return in 2025, proving its dominance as a safe-haven asset during periods of extreme debt expansion.
- [The S&P 500] has returned 15.4% annually over long horizons but remains susceptible to significant Q1 corrections like the 7% drop seen in 2026.
- [The S&P-to-gold ratio] currently sits at 1.57, a decline from 1.66, signaling that investors are rotating capital toward defensive commodity positions.
- [Strategic gold allocation] of 10% to 15% is recommended by 2026 analysts to buffer against the volatility of tech-heavy equity portfolios.
- [Risk-adjusted returns] show that while equities have a higher long-term Sharpe ratio, gold acts as a critical “tail-risk” volatility dampener.
- [Inflation hedging] remains the primary driver for both assets, though gold typically responds more reactively to spikes in headline CPI.
Frequently Asked Questions
This article contains references to gold and the S&P 500, and Volity, a regulated CFD trading platform. This content is produced for educational purposes only and does not constitute financial advice or a recommendation to buy or sell any financial instrument. Always consult a qualified financial advisor before adjusting your portfolio allocation. Some links in this article may be affiliate links.
Related reading: trading gold guide.