The gold and stocks correlation is low and it moves around: over 30 years of monthly data, it ranges from near zero to negative against major equity indices. Gold has held up in most deep stock sell-offs, including 2008, but not every time: between 9 and 18 March 2020, as investors sold assets for cash, gold fell 12%.
TL;DR: Over 30 years, gold’s correlation with major stock indices sits between near zero and negative. In calendar 2008 the S&P 500 lost 36.55% and gold gained 4.32%. In 2022 stocks lost 18.04% and gold was roughly flat at +0.55%. In March 2020 and again in March 2026, gold fell about 12%. A gold slice can soften a sell-off. It does not cancel one.
Below, every figure carries its source and period, followed by the arithmetic of a gold slice and a hedge you can test on a demo.
What the gold and stocks correlation measures
Correlation is a number between -1 and +1. It tells you how consistently two prices move in the same direction. At +1 they move in lockstep. At -1 one rises whenever the other falls. Near zero, knowing what stocks did tells you little about what gold did. It is also called the gold and equities correlation.
It measures direction, not size. So a low coefficient alone cannot tell you how much protection gold gives. You also need the returns in the bad periods, which the sections below supply.
The data frequency changes the answer. State Street Investment Management, which sells gold funds, uses monthly returns over 30 years in its Invest in gold guide. The World Gold Council (WGC) safe-haven study uses weekly returns of the LBMA Gold Price since March 1991. A monthly figure can hide a sharp week.
Two words often get mixed up. In their paper Is Gold a Hedge or a Safe Haven?, Baur and Lucey call an asset a hedge when it does not move with stocks on average. A safe haven is an asset that holds its value in a crash. Gold can be one without the other.
What history shows over decades and in shorter windows
Over the long run the link is weak. State Street’s guide says that in major equity markets, such as the US and Japan, gold’s correlation “ranges from near zero to negative”. That covers 30 years of monthly data to 30 September 2026. Per-index values appear only in a chart, so none is quoted here. It also puts gold’s highest correlation with any bond index it shows at 0.32, against US investment-grade bonds.
Averages hide the timing. Using US, UK and German data, Baur and Lucey found gold worked as a hedge on average and as a safe haven in extreme conditions. The protection was short: their working paper found gold was a safe haven for stocks “only for 15 trading days after an extreme shock occurred”. The version published in the Financial Review in 2010 calls the safe-haven effect “short-lived”.
Single years can flip. The NYU Stern returns table kept by Aswath Damodaran shows gold down 27.61% in 2013 while the S&P 500 returned 32.15%. In 2025 both rose strongly: the S&P 500 by 17.78% and gold by 66.22%.
The Bank for International Settlements (BIS) flagged that 2025 pattern in its December 2025 Quarterly Review. It found gold and the S&P 500 in “explosive” price behaviour at the same time, the only such episode in at least 50 years. The BIS linked part of gold’s rise to trend-chasing retail buyers. For the wider frame, see how risk assets differ from defensive ones.
Other asset pairs shift too. The European Central Bank (ECB) wrote in a November 2022 Financial Stability Review box that the stock-bond correlation “tended to be positive between the late 1960s and the late 1990s but turned negative during the 2000s”. The lesson carries over to gold: a coefficient sums up a past period. It is not a fixed property.
Gold in market stress: 2008, 2020 and 2022
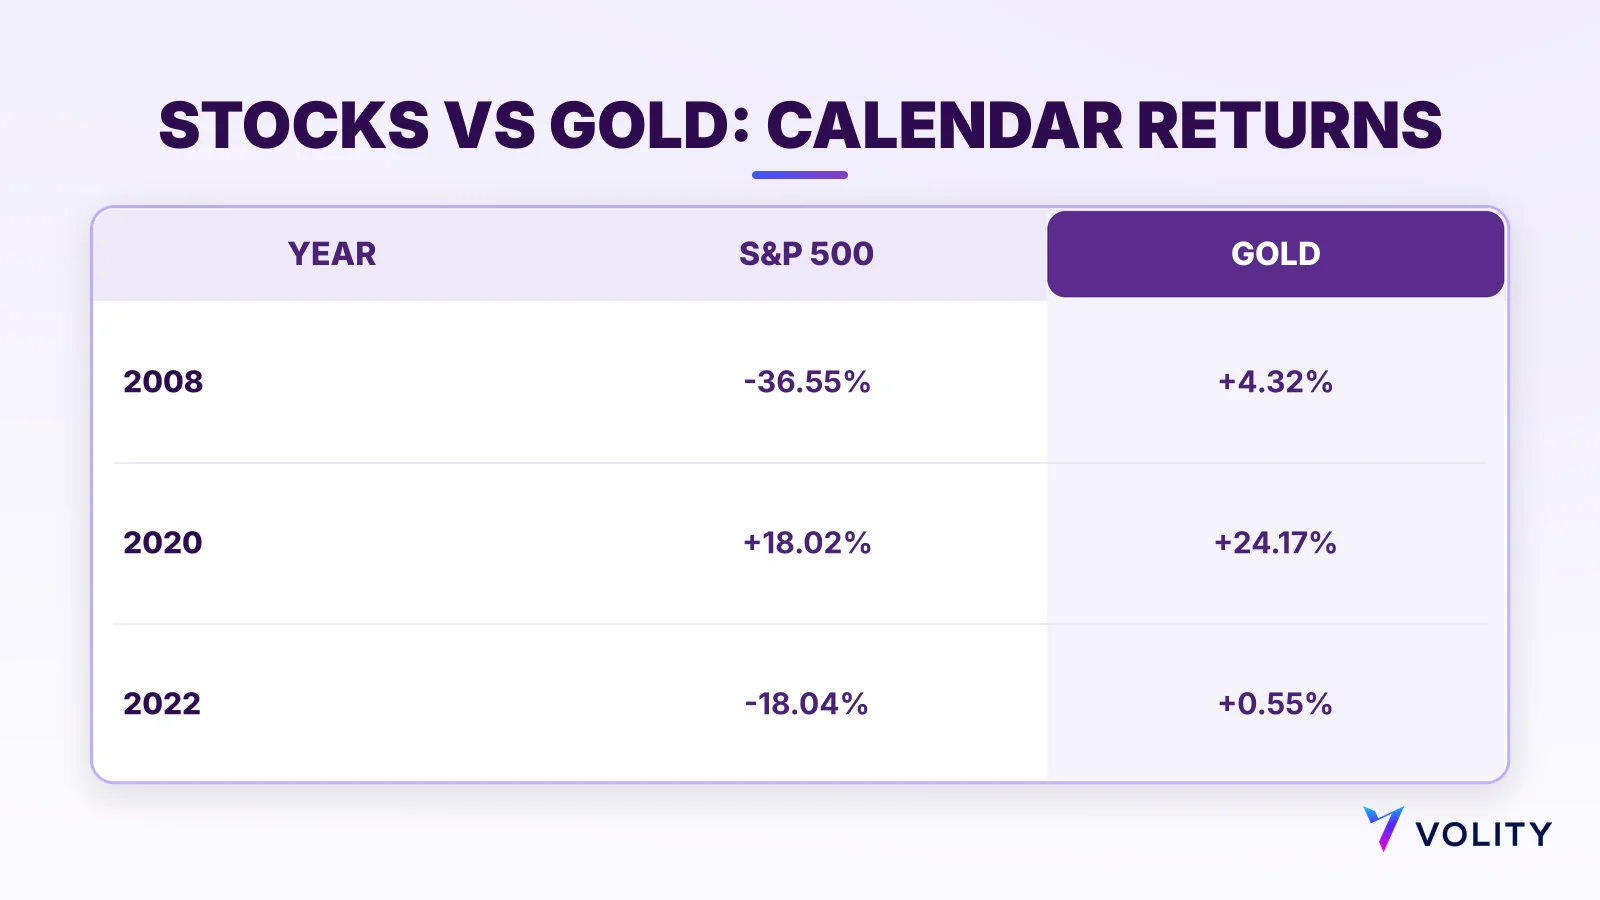
Calendar-year returns from the NYU Stern table put the episodes on one basis. S&P 500 figures include dividends; gold is the price change.
| Year | S&P 500 | Gold | What happened |
|---|---|---|---|
| 2008 | -36.55% | +4.32% | Gold gained while stocks lost over a third |
| 2020 | +18.02% | +24.17% | Both up for the year, after a March crash |
| 2022 | -18.04% | +0.55% | Gold flat while stocks and bonds fell |
2008 is the year gold’s reputation rests on. Stocks lost 36.55% and gold gained 4.32%. The gain was modest. The value came from not falling while stocks did.
2020 hides an exception inside a good year. In a speech of 10 February 2022, Jon Cunliffe, Deputy Governor for Financial Stability at the Bank of England, described the March 2020 dash for cash. Gold had risen about 4% in the first phase of the sell-off, in February. Then, between 9 and 18 March, investors sold their most liquid assets and gold fell by 12%. It still ended the year up 24.17%.
2022 was a different kind of bad year. Stocks fell 18.04%, and 10-year US Treasury bonds lost 17.83%, so the usual bond cushion failed. Gold returned +0.55%. That is no gain, but no loss either, in a year when both main assets fell.
The 2020 pattern came back in March 2026. The WGC commentary Anatomy of a fall reports gold down 11.8% in US dollars, to US$4,608 an ounce. It was gold’s weakest month since June 2013, during an equity sell-off. The WGC blamed “deleveraging and liquidity dynamics, not fundamentals”. Global gold ETFs shed US$12bn, or 84 tonnes.
The wider record is kinder than those two months. State Street’s guide counts 14 S&P 500 falls of more than 15%, peak to trough, between 25 August 1987 and 30 September 2026. In those falls gold averaged +5.89%, against -23.70% for the S&P 500 total return. Gold was positive in 11 of the 14 and negative in 3. These are the issuer’s figures, from a firm that sells gold funds.
Gold, stocks and bonds when they fall together
A classic stock and bond portfolio relies on bonds rising when stocks fall. 2022 broke that. The S&P 500 fell 18.04% and the 10-year Treasury fell 17.83% in the same calendar year.
In November 2022 the ECB said the stock-bond correlation “has increased recently”. When stocks and bonds move together, a portfolio of the two has less protection inside it.
Gold’s own correlations matter more then. The State Street guide puts gold’s highest correlation with any bond index at 0.32, and its link to equities at near zero to negative. In Why gold in 2026?, the WGC argues that gold “should be supported in the medium term via stronger inflation-hedging demand and a higher stock-bond correlation”. Its strategic asset report calls gold “a clear complement to stocks and bonds”. Both are views of a gold industry body. Gold also has drivers stocks and bonds do not share; see how central banks influence gold prices.
Using the correlation in a portfolio, and where it stops working
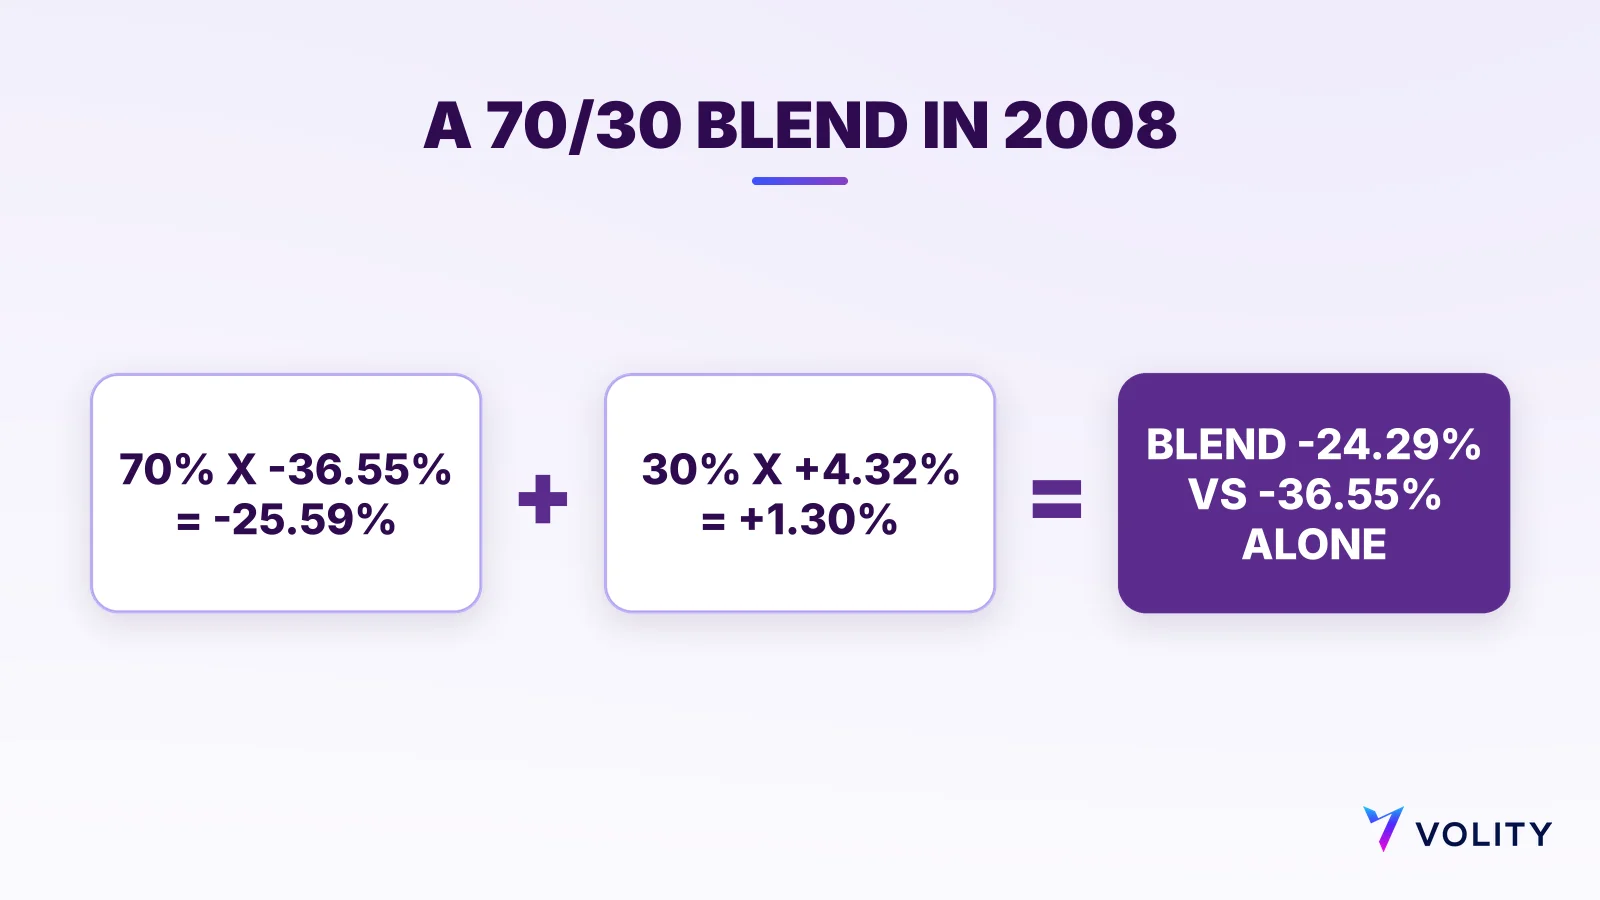
The simplest use is a gold slice: a fixed share of the portfolio held in gold. The table below is arithmetic on the historical calendar returns. It is not a forecast or a product. It weights a portfolio 70% S&P 500 and 30% gold and applies each year’s returns, with no rebalancing during the year.
| Year | 70% x S&P 500 | 30% x gold | 70/30 blend | S&P 500 alone |
|---|---|---|---|---|
| 2008 | -25.59% | +1.30% | -24.29% | -36.55% |
| 2022 | -12.63% | +0.17% | -12.46% | -18.04% |
| 2020 | +12.61% | +7.25% | +19.87% | +18.02% |
Take 2008 step by step. 70% of -36.55% is -25.59%. 30% of +4.32% is +1.30%. Added together, the blend lost 24.29%, which is 12.26 points less than stocks alone.
Read 2022 more carefully. The blend lost 5.58 points less than stocks, but gold added only 0.17 points of that. Almost all of the cushion came from holding less in stocks.
State Street adds an issuer claim. It estimates that adding 10% gold to a 60/40 stock and bond portfolio cut drawdowns by 182 basis points on average, across 13 stress windows since 1990. That is 1.82 percentage points, and it is the issuer’s own analysis.
The correlation has real limits:
- It looks backwards. A 30-year figure says nothing certain about next month.
- Cash squeezes break it. In March 2020 and March 2026 gold fell about 12% as holders sold what they could.
- Gold can run with stocks. The BIS found both in explosive territory at once in 2025, which weakens diversification while it lasts.
- Gold pays no income. A flat year like 2022 earns nothing on that slice; compare gold with a savings account.
- Gold has weak spells of its own. It lost 27.61% in 2013 and 12.11% in 2015.
For the timing question, see is it a good time to buy gold. For longer return and risk figures, read gold vs the S&P 500.
Trading gold against stocks on Volity
Spot gold trades on Volity as a CFD: XAU/USD and XAU/EUR, long or short, from the same account that holds forex, indices, commodities and crypto. A CFD (contract for difference) pays the change in a price; you never own the asset. The US 500, a CFD that tracks the S&P 500, sits in the same account. Both trade 24/7 on Volity. If the gold quote is new to you, start with what XAU means.
Leverage lets you put up a fraction of a position’s value, called margin, and trade the full size. Volity offers leverage up to 1:500 on metals and index CFDs. The margin can be small. Profit and loss are still calculated on the full exposure, so losses can exceed the margin you put up.
Some regulators set their own retail limits. Under the UK FCA’s policy statement PS19/18, retail clients must post at least 5% margin on gold and major stock indices, which caps leverage at 20:1. The EU regulator ESMA has also restricted CFDs sold to retail investors.
A hedge example with hypothetical numbers
Say you hold a long US 500 position with $10,000 of exposure and add a long gold position with $3,000 of exposure. These numbers are hypothetical, chosen for easy arithmetic. Exposure is the full value of the position, not the margin.
| Scenario (hypothetical) | US 500 | Gold | US 500 result | Gold result | Net | Without gold |
|---|---|---|---|---|---|---|
| A: stocks fall, gold holds up | -20% | +5% | -$2,000 | +$150 | -$1,850 | -$2,000 |
| B: stocks fall, gold flat | -18% | +0.5% | -$1,800 | +$15 | -$1,785 | -$1,800 |
| C: both sold for cash | -20% | -10% | -$2,000 | -$300 | -$2,300 | -$2,000 |
Scenario A follows the direction of 2008. The $150 gold gain offsets 7.5% of the $2,000 loss, so a small gold position gives a small cushion. Scenario B, like 2022, barely helps. Scenario C follows the direction of March 2020 and March 2026, when gold was sold for cash: the same gold position adds $300 to the loss.
A more direct hedge is a short US 500 CFD against shares you already hold. Going short means you gain if the index falls. That offsets the equity exposure itself, whatever gold does. Volity lists both markets, long or short, in one account.
Test the idea on a demo first
- Open a free demo account. A demo is available on every Volity account tier.
- Add XAU/USD and the US 500 to one watchlist, so you see both prices side by side.
- Pick an exposure ratio, such as the hypothetical $10,000 and $3,000 above, and write it down before you trade.
- Place both positions and set a stop-loss on each. A stop-loss is an order that closes the trade at a price you choose.
- Watch a volatile week and note when the two prices move together and when they split.
- Check live spreads and margin on the platform, and the full cost schedule on the charges and fees page.
Features are in the gold trading platform guide; strategies are on the gold hub.
Fact check: Calendar returns from NYU Stern (Damodaran, updated 5 January 2026). Correlation ranges and drawdown counts from State Street Investment Management’s Invest in gold guide (data to 30 September 2026), an issuer document. Also the Bank of England (10 February 2022), World Gold Council (8 April 2026), BIS (December 2025), ECB (November 2022), Baur and Lucey (2010) and FCA PS19/18. Sources checked 10 November 2026.
Frequently asked questions
Does gold go up when stocks go down?
Often, but not always. In State Street’s count of 14 S&P 500 falls of more than 15% since 1987, gold rose in 11. It fell 12% in the March 2020 dash for cash and 11.8% in March 2026.
Is gold a good hedge against a stock market crash?
On average gold has been a hedge, meaning it does not move with stocks. Baur and Lucey found it acted as a safe haven in extreme conditions, but only for about 15 trading days after the shock. It can cushion a crash. It does not cancel one.
How did gold do in 2022 when stocks and bonds fell?
Gold returned +0.55% in 2022, per NYU Stern. The S&P 500 lost 18.04% and 10-year US Treasuries lost 17.83%. Flat was the best result of the three.
What correlation is good for diversification?
The closer to zero or below zero, the more independently an asset moves from what you already hold. There is no official cut-off. Check returns in stress periods too, because correlation ignores the size of moves.
How much gold should a portfolio hold?
No single figure suits everyone, and this is not advice. The 70/30 table above shows how a 30% gold slice changed results in 2008, 2020 and 2022. State Street models a 10% slice. Size yours to your goals and the losses you can accept.
Can I trade gold and the S&P 500 from one account?
Yes. On Volity, XAU/USD, XAU/EUR and the US 500, which tracks the S&P 500, are CFDs in the same account, long or short. A free demo lets you test both before using real money.