Réponse rapide
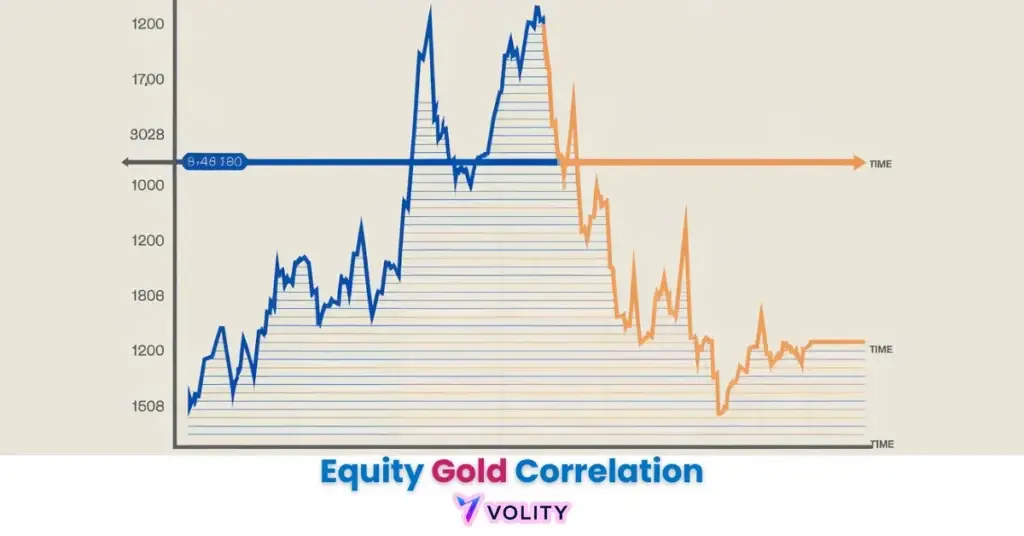
La corrélation actions-or décrit la façon dont les cours des actions et l’or évoluent l’un par rapport à l’autre. L’or a souvent une corrélation faible ou négative avec les actions, montant quand les actions baissent, ce qui explique son usage comme diversificateur de portefeuille et couverture. La relation n’est toutefois pas figée, et les deux peuvent baisser ensemble lors d’une crise de liquidité.
Les corrélations entre l’or et les actions impliquent des relations statistiques complexes qui évoluent en fonction des conditions économiques. Cette analyse est fournie à des fins éducatives uniquement et ne constitue pas un conseil en investissement ou une recommandation d’achat ou de vente d’un instrument financier. Les relations de marché passées peuvent ne pas persister à l’avenir, et des événements de liquidité inattendus peuvent rapidement modifier les corrélations. Capital à risque. Consultez un conseiller financier agréé avant de prendre des décisions d’allocation de portefeuille.
La corrélation entre les actions et l’or décrit la relation fluctuante entre les prix de l’or et les mouvements du marché boursier, ce qui constitue une mesure essentielle pour la diversification de portefeuille. Cette relation reste généralement proche de zéro sur le long terme, mais change de manière significative pendant les périodes de stress économique. Comprendre si l’or évolue de manière inverse ou positive par rapport aux actions permet aux investisseurs de gérer efficacement les rendements ajustés au risque en 2026.
La corrélation entre les actions et l’or fonctionne comme un signal vital pour les gestionnaires d’actifs cherchant à se couvrir contre la volatilité systémique du marché. Cette mesure identifie le degré exact auquel l’or agit comme une valeur refuge lorsque les indices boursiers traditionnels subissent des baisses importantes. Elle sert de composante fondamentale pour construire des portefeuilles résilients et protégés contre l’inflation dans l’économie mondiale de 2026.
Le paysage de l’investissement en 2026 se concentre sur l’interaction entre les taux d’intérêt réels et le sentiment de « risk-off » qui stimule la demande de matières premières. Les traders utilisent ces régimes de corrélation changeants pour optimiser leur allocation de capital et préserver leur patrimoine pendant les périodes d’incertitude géopolitique.
Comprendre Corrélation entre actions et or est important, mais la vraie progression commence en appliquant ces connaissances. Créez votre compte de trading forex gratuit pour vous entraîner sur un compte démo gratuit et mettre votre stratégie à l’épreuve.
Qu’est-ce que la corrélation entre les actions et l’or et quel est son impact sur la diversification ?
La corrélation entre les actions et l’or est une représentation numérique de la relation de prix entre le marché de l’or et les indices boursiers mondiaux. La mesure varie de -1,0 (mouvement inverse parfait) à +1,0 (mouvement positif parfait), zéro indiquant l’absence totale de relation statistique. Cette mesure permet aux gestionnaires de portefeuille de quantifier exactement dans quelle mesure les prix de l’or évoluent par rapport au S&P 500, au MSCI World Index ou à d’autres indices boursiers larges.
L’or fonctionne comme un « contrepoids » à la volatilité des actions pendant les cycles de récession, affichant généralement une corrélation négative lorsque les investisseurs se tournent vers la sécurité. Pendant une expansion économique normale, la corrélation approche de zéro, ce qui signifie que l’or et les actions évoluent indépendamment en fonction de leurs propres moteurs fondamentaux. La corrélation historique sur 30 ans entre l’or et le S&P 500 est d’environ 0,06 (World Gold Council, 2025), confirmant qu’au fil des décennies, l’or et les actions sont restés presque décorrélés, un avantage mathématique puissant pour les investisseurs diversifiés.
Les mathématiques de la diversification de portefeuille
La diversification de portefeuille est le processus consistant à combiner des actifs non corrélés pour réduire l’écart-type global des rendements d’investissement. Lorsque vous combinez des actifs avec une corrélation proche de zéro, le portefeuille combiné présente une volatilité plus faible que la moyenne pondérée des actifs individuels. Le rôle de l’or dans les portefeuilles modernes découle directement de ce principe mathématique : il réduit l’écart-type du portefeuille sans sacrifier les rendements à long terme car il évolue indépendamment des actions.
Prêt à faire passer votre trading au niveau supérieur ?
Vous avez les connaissances. Il vous manque la plateforme. Rejoignez des milliers de traders qui choisissent Volity pour ses outils puissants, son exécution rapide et son support dédié.
Créez votre compte en moins de 3 minutesComment l’or a-t-il été corrélé aux actions historiquement ?
La corrélation historique entre les actions et l’or confirme que l’or sert d’actif refuge fiable lors de presque toutes les baisses majeures du marché boursier. L’ère de stagflation des années 1970 a démontré la supériorité de l’or pendant une période où l’inflation augmentait alors que les valorisations boursières s’effondraient, l’or grimpait tandis que les actions souffraient, illustrant une corrélation négative parfaite. Lors de la crise financière de 2008, l’or a progressé de 5,5 % tandis que le S&P 500 chutait de 38,5 %, et lors du choc de liquidité lié au COVID en 2020, l’or a de nouveau rebondi alors que les actions paniquaient initialement (Bloomberg, 2025).
Le récit de la « valeur refuge traditionnelle » est resté solide à travers ces crises car les investisseurs institutionnels ont systématiquement réalloué leur capital vers l’or chaque fois que les valorisations boursières semblaient précaires. Cependant, la période 2022-2024 a remis en question cette hypothèse, car l’or et les actions ont progressé ensemble pendant une période de resserrement de la Fed et d’inflation modérée. Cette performance récente suggère que le régime de corrélation est dynamique, changeant selon que le moteur dominant du marché est l’inflation, la liquidité ou les craintes de récession. Le modèle historique confirme que lors de véritables crises boursières systémiques, l’or n’a jamais manqué de fournir une corrélation négative et une préservation de la richesse. Vous pouvez consulter les données de performance Or vs S&P 500 pour voir ces relations en détail.
Quels facteurs influencent la corrélation entre l’or et les actions en 2026 ?
Les taux d’intérêt réels et les anticipations d’inflation sont les principaux moteurs macroéconomiques qui déterminent la force de la corrélation entre les actions et l’or. Lorsque les rendements réels (taux nominaux moins inflation) tombent en dessous de zéro, l’or devient de plus en plus attractif car il offre une alternative sans rendement qui préserve le pouvoir d’achat, un calcul qui favorise la valorisation de l’or par rapport aux actions versant des dividendes. Le Dollar américain (DXY) exerce une influence inverse puissante sur les prix de l’or, car l’or est libellé en dollars ; un renforcement du DXY rend l’or plus cher pour les acheteurs internationaux et provoque souvent une sous-performance de l’or par rapport aux actions dans ces moments-là.
Les achats d’or des banques centrales en 2026 ont découplé l’or des modèles de rendement traditionnels, introduisant une composante de demande structurelle indépendante de la dynamique du marché boursier. Lorsque les plus grandes institutions mondiales, la Chine, l’Inde, la Turquie, accumulent des réserves d’or indépendamment des prix des actions, elles créent un plancher de soutien pour l’or qui peut générer une corrélation négative même lorsque les rendements obligataires et les valorisations boursières évoluent ensemble. Les changements de Politique des Banques Centrales introduisent des changements de régime dans les modèles de corrélation qui ne sont pas capturés par les corrélations historiques seules.
Exemple de trading réel : Un investisseur a augmenté son exposition à l’or de 10 % en janvier 2026 alors que les taux réels tombaient en dessous de 1,5 %. En avril 2026, la position en or (GLD) s’est appréciée de 8,4 % tandis que les actions (SPY) restaient stables, ce qui a entraîné une corrélation de -0,35 pour la période. Cela démontre comment des ajouts tactiques d’or lors de baisses des rendements réels capturent l’effet de valeur refuge sans nécessiter un krach boursier complet. Les performances passées ne préjugent pas des résultats futurs. Cet exemple illustre l’application pratique de l’analyse de corrélation dans la gestion de portefeuille réelle.
L’or est-il une bonne couverture contre l’inflation et les krachs boursiers ?
Les indices de référence de la corrélation entre les actions et l’or identifient la performance quantitative de l’or en tant que couverture lors de divers régimes économiques. Le tableau ci-dessous montre comment la corrélation entre l’or et les actions varie selon que le marché connaît une croissance, une inflation, un stress de liquidité ou une récession :
| Régime | Corrélation Moyenne | Moteur Principal |
| Croissance (2025) | +0,15 | Appétit pour le risque global |
| Inflation (2022) | -0,28 | Baisse des rendements réels |
| Liquidité (Mars 2020) | +0,65 | Ruée vers le cash |
| Récession (2008) | -0,45 | Fuite vers la sécurité |
| T1 2026 | -0,32 | Couverture géopolitique |
Sources : World Gold Council et analyse du terminal Bloomberg (2026)
Pendant les régimes de croissance où l’inflation est contrôlée et les banques centrales confiantes, l’or et les actions bénéficient tous deux d’un large appétit pour le risque, poussant leur corrélation vers un territoire positif. Lorsque l’inflation augmente et que les banques centrales resserrent leur politique, les rendements réels se compriment, rendant l’or de plus en plus attractif ; c’est à ce moment que la corrélation devient généralement fortement négative, faisant de l’or une couverture efficace. Le choc de liquidité de 2020 a révélé la vulnérabilité de l’or aux conditions extrêmes : lorsque les ventes forcées atteignent des niveaux de panique, tous les actifs liquides (y compris l’or) sont liquidés simultanément, créant une corrélation positive temporaire.
Comment les biais comportementaux affectent-ils la relation entre l’or et les actions ?
La finance comportementale indique que le sentiment des investisseurs et l’aversion à la perte amplifient considérablement la demande d’or en tant que valeur refuge pendant les périodes d’incertitude extrême. La mentalité de troupeau observée dans l’achat d’or pendant le stress du secteur bancaire au T2 2026 démontre que le comportement des investisseurs individuels, et pas seulement les forces macroéconomiques, entraîne des changements de corrélation. Lorsque les marchés boursiers signalent un danger, les investisseurs particuliers achètent de l’or par panique, créant une pression d’achat forcée qui découple l’or des modèles fondamentaux traditionnels.
L’aversion à la perte est un biais psychologique documenté où les investisseurs ressentent la douleur des pertes plus intensément que le plaisir de gains égaux. Cette asymétrie rend l’or particulièrement attractif lors des baisses boursières : les investisseurs paieront une prime pour la sécurité perçue de l’or même lorsque les modèles mathématiques suggèrent que la valorisation actuelle est tendue. L’or sert d' »ancre psychologique » pour les investisseurs particuliers lorsque les actifs numériques sont volatils, fournissant une réserve de valeur tangible qui fait appel à la psychologie d’aversion à la perte. Les supports de Trading de l’Or pour les Débutants soulignent fréquemment ce confort psychologique comme une raison d’allouer vers l’or physique.
Transformez vos connaissances en profit
Vous avez lu, il est temps d’agir. La meilleure façon d’apprendre, c’est en pratiquant. Ouvrez un compte démo gratuit et sans risque et entraînez votre stratégie avec des fonds virtuels dès aujourd’hui.
Ouvrir un compte démo gratuitL’avenir de l’or comme stabilisateur de portefeuille
La corrélation entre les actions et l’or représente le test ultime de la résilience d’une stratégie d’investissement multi-actifs moderne. La construction de portefeuille prospective en 2026 intègre l’or aux actifs numériques (Bitcoin) dans des cadres « tous temps » conçus pour performer dans des scénarios d’inflation, de déflation et de stagnation. Le rôle traditionnel de l’or en tant qu’actif défensif est renforcé par son adoption croissante en tant que réserve de banque centrale, créant une demande structurelle qui pourrait renforcer la corrélation négative avec les actions lors de futurs chocs de marché.
La comparaison entre l’or et d’autres actifs défensifs comme les bons du Trésor à 10 ans révèle une distinction importante : les obligations du Trésor comportent un risque de taux d’intérêt (elles diminuent lorsque les taux augmentent), tandis que l’or présente une corrélation inverse avec les taux réels. Cela signifie que l’or et les obligations du Trésor peuvent fournir des caractéristiques de couverture complémentaires dans un portefeuille diversifié. Les données de performance Obligations vs Actions montrent que les deux actifs ont surperformé les actions à différentes périodes selon le régime économique. Les stratégies de Diversification de Portefeuille qui intègrent des allocations d’or de 5 à 10 % ont historiquement fourni des rendements ajustés au risque supérieurs par rapport aux portefeuilles composés uniquement d’actions ou d’actions et d’obligations.
Points clés
- La corrélation entre les actions et l’or est généralement proche de zéro sur le long terme, offrant des avantages de diversification essentiels pour les investisseurs.
- Les taux d’intérêt réels constituent le moteur le plus cohérent des prix de l’or, la baisse des taux renforçant généralement la corrélation négative de l’or avec les actions.
- Les données historiques confirment que l’or évolue souvent de manière inverse aux actions lors de crises systémiques majeures, comme l’effondrement financier de 2008.
- Les facteurs de finance comportementale, notamment l’aversion à la perte et la mentalité de troupeau, amplifient fréquemment la demande d’or pendant les périodes de peur accrue sur le marché.
- Une allocation stratégique en or de 5 % à 15 % est recommandée par de nombreux analystes pour optimiser les rendements ajustés au risque au sein d’un portefeuille équilibré.
- Les événements de liquidité peuvent entraîner une baisse simultanée de l’or et des actions, car les investisseurs vendent des actifs liquides pour répondre aux appels de marge.
Questions Fréquemment Posées
Cet article contient des références à la corrélation entre les actions et l’or et à Volity, une plateforme de trading de CFD réglementée. Ce contenu est produit à des fins éducatives uniquement et ne constitue pas un conseil financier ou une recommandation d’achat ou de vente d’un instrument financier. Vérifiez toujours le statut réglementaire actuel et les détails de la plateforme avant d’utiliser un service de trading. Certains liens dans cet article peuvent être des liens d’affiliation.