Gold set a record in January 2026 and has since lost about a fifth of its price, so is it a good time to buy gold now? Nobody can time it, and no chart will answer that for you. What you can test is whether your reason for buying, the amount you put in and your exit plan still hold up whatever the price does next. This guide turns that test into a written checklist, with the 2026 data, gold’s history after past peaks and a staged plan you can practise first.
TL;DR: On 25 September 2026 the LBMA gold benchmark was $4,261.05 an ounce, 21.2% below its 29 January 2026 record of $5,405.00. After the 1980 and 2011 peaks, gold took almost 28 and almost 9 years to recover. Set your reason, size and exit first, buy in stages on fixed dates and rehearse on a free demo.
Measured by the LBMA Gold Price, the official London benchmark, gold rose 67.4% in 2025 with 53 record prices and set 12 more in January 2026. On 30 January, the day after the last one, it fell about 10% (Al Jazeera). It hit a 2026 low of $3,993.55 on 16 July, recovered in August and slipped just below $4,150 on 28 September (FXStreet). In euros and pounds the fall from their own 2 March peaks is smaller, at 17.6% and 18.9%.
Check what drove gold’s record run and what is holding it back
Central banks, which manage a country’s money and reserves, have been the steadiest buyers. The World Gold Council (WGC), the industry body that tracks demand, counted 289 tonnes of central-bank buying in the second quarter of 2026, a record for a second quarter, after a first quarter of just 57 tonnes (revised). In the WGC’s 2026 survey, 89% of the central banks that answered expected global gold reserves to rise over the next year.
Fund buyers came back too. A gold ETF (exchange-traded fund) trades on a stock exchange like a share and holds physical gold for its investors. In August 2026 these funds took in $18 billion and their holdings reached a record 4,189 tonnes (WGC).
The brake is interest rates. Gold pays no interest, so when cash and bonds pay more, holding gold means giving up that income. The US Federal Reserve raised its target range to 3.75%-4.00% on 16 September, the European Central Bank raised its key rates by 0.25 percentage points on 10 September, and the Bank of England held Bank Rate at 3.75% on 17 September, with three of nine votes for a rise. The 10-year US government bond yield, the yearly interest a buyer locks in at today’s price, hit a 2026 high of 5.24% on 28 September (US Treasury).
The US-Iran conflict pulls both ways. Tension can send buyers to gold as a safe place for money, but the conflict has also pushed oil up, and dearer oil feeds inflation, which makes more rate rises likely. The ECB said the conflict in the Middle East “continues to generate inflation pressures”. On 28 September, Yahoo Finance tied gold’s slide to oil, a stronger dollar and a more than 70% chance of an October Fed rise.
Before you buy, note the latest reading for each of these signals and whether it pushes gold up or down. Recheck the list on every buying date.
Look at what history says about buying near a record high
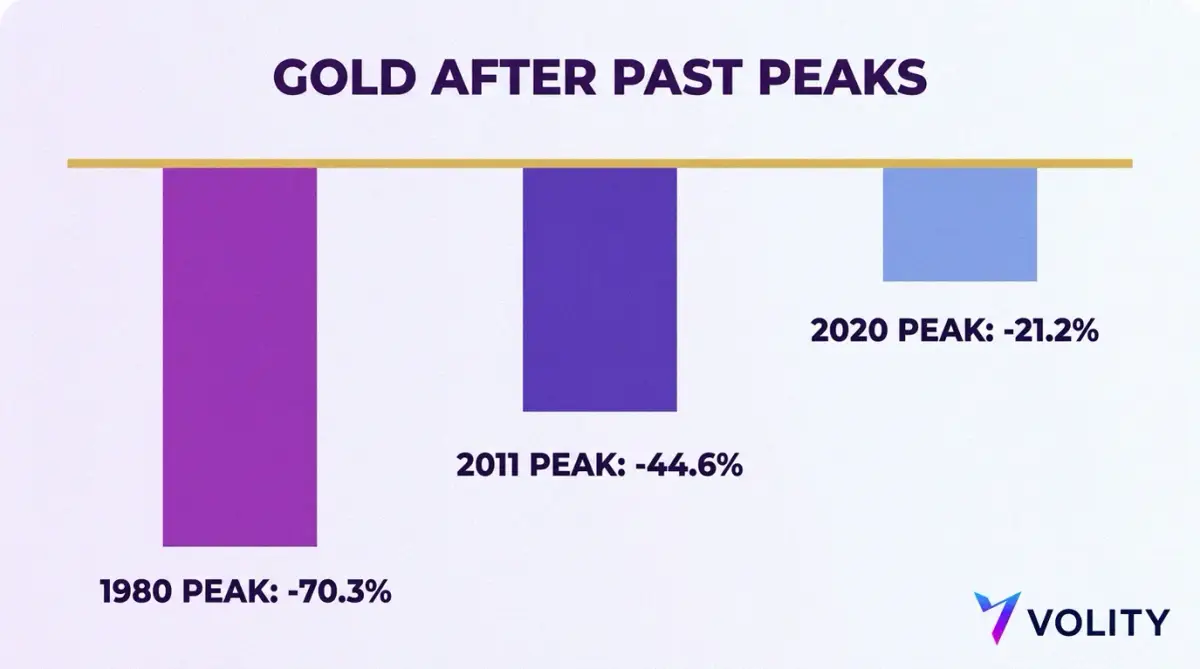
Gold has been here before, and the waits were long (LBMA afternoon prices, US dollars per ounce).
| Peak | Peak price | Lowest price after it | Fall | Back above the peak |
|---|---|---|---|---|
| 21 Jan 1980 | 850.00 | 252.80 (Jul 1999) | -70.3% | Jan 2008, almost 28 years later |
| 5 Sep 2011 | 1,895.00 | 1,049.40 (Dec 2015) | -44.6% | Jul 2020, almost 9 years later |
| 6 Aug 2020 | 2,067.15 | 1,628.75 (Nov 2022) | -21.2% | Dec 2023, about 3.4 years later |
| 29 Jan 2026 | 5,405.00 | 3,993.55 so far (Jul 2026) | -26.1% so far | Not yet (4,261.05 on 25 Sep 2026) |
Adjusted for inflation, the 1980 record was only passed in September 2025, about 45 years later (IPMI).
Research on buying shares at record highs is far kinder. Schroders found that the market for large US companies ended 31% of months since 1926 at a record, and that returns in the following 12 months averaged 10.4% above inflation, against 8.8% after other months. J.P. Morgan Asset Management notes that since 1950 the S&P 500 has set a record on roughly 7% of trading days, and almost a third of those highs became “floors” the index never closed below again. Barclays Private Bank found “little difference” in returns after highs since 2000.
That research is about company shares, which earn profits and pay dividends. Gold does neither, so the comfort does not carry over one for one. Decide now how long you could hold through a fall like 2011 to 2015, when gold lost about 45% over four years, without selling. If the honest answer is “not long”, buy less.
Decide why you want gold before you pick a price
For long-term insurance, you buy a small, fixed share of your savings to hold for years, and once a year you trim it or top it up to keep that share (rebalancing). The WGC’s portfolio research tests shares of 2.5% to 10%. In its 20-year US dollar example, a 5% gold share lifted the average yearly return from 6.7% to 7.0% and cut the worst fall from 34.9% to 32.7%. The FCA’s golden rules of investing suggest holding for at least five years and warn that “trying to time the market increases your risk of buying or selling at the wrong time”.
To trade a view, for example that interest rates are close to their peak, you think in weeks or months, need a set exit and may want to go short (profit from a fall) as well as long. A CFD (contract for difference) lets you trade the price move without owning the metal. Each night a position stays open past 22:00 GMT it pays or earns an overnight fee, so a CFD suits a view with an end date better than a holding for years. These gold trading strategies cover the trade case.
Write your reason and your time frame in one sentence before you look at the price. If you cannot finish it, wait.
Build the position in stages
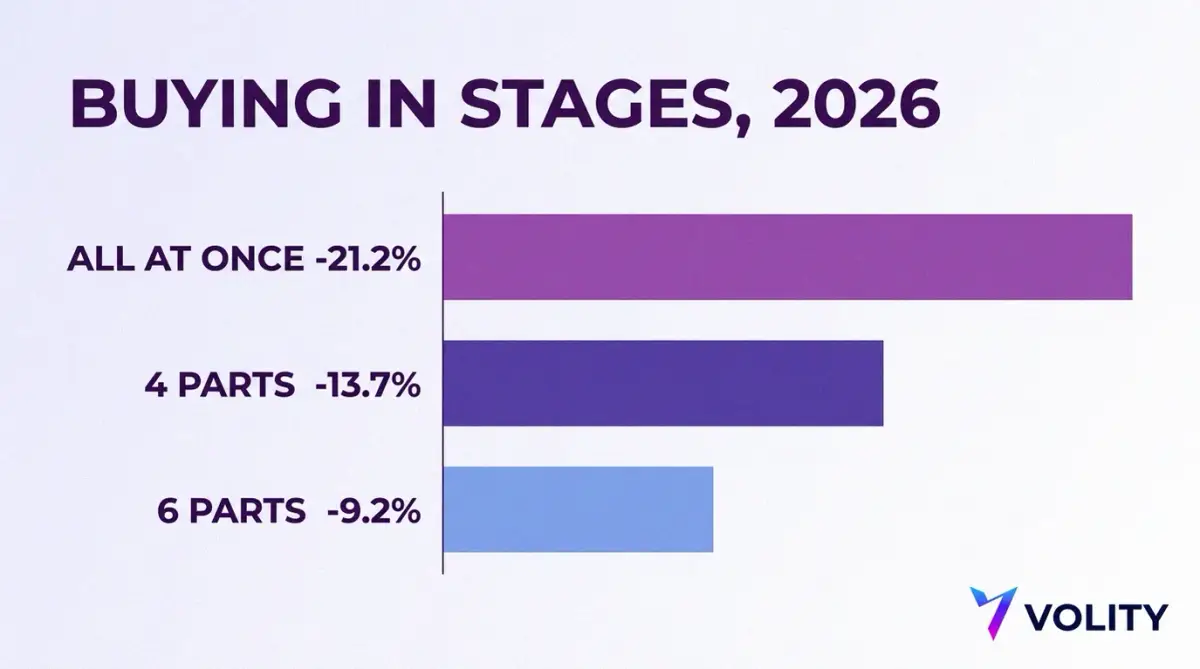
Buying in stages means splitting your gold money into equal parts and buying one part on each of several fixed dates, whatever the price. In the UK this is called pound-cost averaging; the Volity guide to dollar-cost averaging explains it. Here is how $10,000 invested from the record day would have fared, valued at $4,261.05 on 25 September 2026.
| Plan | Buying dates (2026) | Average cost per ounce | Value on 25 Sep 2026 | Result |
|---|---|---|---|---|
| All at once | 29 Jan | $5,405.00 | $7,883.53 | -21.2% |
| 4 monthly parts | 29 Jan to 30 Apr | $4,936.11 | $8,632.40 | -13.7% |
| 6 monthly parts | 29 Jan to 30 Jun | $4,692.22 | $9,081.10 | -9.2% |
Six parts cut the loss by more than half but did not prevent one, and the first benchmark price more than 10% below the record, on 2 February 2026, was not the bottom.
Staging lowers regret more than it raises returns. Vanguard found that a lump sum invested straight away beat drip-feeding between 61.6% and 73.7% of the time across the markets it studied, including UK shares from 1986 to 2022, because markets rise more often than they fall. What staging gives you is a rule to follow when a price near a peak makes you nervous:
- Choose the total you are prepared to put into gold and write it down.
- Split it into three to six equal parts.
- Fix the buying dates, for example the last working day of each month.
- Decide now what you will do if the price drops 10% between dates: buy the next part early or stick to the calendar.
- Record each purchase: date, price, amount and running average cost.
- On each date, recheck the signals from the first section and change the plan only if your reason has changed.
If you place each part as a trade, check the best time to trade gold first.
Set your exit and your position size before you enter
Size comes before price. The FCA suggests an emergency fund of 3 to 6 months of outgoings before you invest, and no more than 10% of your total net assets in high-risk investments. Count money for leveraged trading inside that 10%. Leverage lets you control a bigger position than your cash would buy, and it magnifies losses as well as gains.
Size each trade from the loss you would accept if you are wrong. For example, with a $10,000 account you might accept losing 1%, or $100. If you buy at $4,200 with an exit at $4,080, each ounce can lose $120, so the position is about 0.83 ounces ($100 divided by $120). Many traders cap the loss on one trade at 1% to 2% of the account. That is a common habit, not a rule. The position size calculator turns this into lots (standard trade units), and the risk-reward calculator weighs the possible loss against the hoped-for gain.
Write the exit down before you place the order: a price that proves you wrong, a target or a review date. A stop-loss order closes the position automatically at your price, but in a fast market it can fill at a worse one. Gold fell about 10% in one day on 30 January 2026.
Use the same checklist on the S&P 500 near its record
The S&P 500, an index of 500 large US companies, closed at a record 7,798.99 on 13 August 2026 and at 7,743.41 on 25 September, 0.7% below it (FRED). By 26 August it had set 27 record closes in 2026 (The Motley Fool).
Run the same checklist: reason, size, stages, exit. The research above is kinder to shares at a record than gold’s history is to gold, because share prices rest on company profits. In 2026 the two also moved apart: in US dollars gold was down 2.4% for the year to 25 September, while the S&P 500 was up about 13% over the same period (FRED). Compare them in S&P 500 vs gold, read how to invest in the S&P 500 index, or see how the US500, the S&P 500 traded as a CFD, works. If you hold both, set one limit for the total loss you could take across the two.
Weighing gold against cash in the bank? Our gold vs a savings account guide runs EUR 10,000 through both from 2021 to 2026, and the best gold trading platforms comparison prices a gold trade before you place one.
Practise the plan on a free demo account
A plan kept in your head tends to change once the price moves against you. Volity gives you a free demo account on every account tier: place the staged buys on your dates, set the exit and the size, and see the live gold spread (the gap between the buying and selling price) and the overnight rate on the platform. Open a free demo and run the plan for a month.
When the plan holds up, trade gold on Volity as a CFD on XAU/USD or XAU/EUR (gold priced in dollars or euros), long or short. A Volity Markets account is commission-free and starts from $1, with funding from EUR 10, and the same account covers indices such as the US500, real shares, fractional shares and crypto, plus a $0 multi-currency wallet. Crypto deposits and all withdrawals are free, and the full fee schedule lists every charge. See the Volity gold trading platform and the gold hub, then open your account. For market insights, education and platform updates, subscribe to “Start Your Days Smarter” at the foot of this page.
Fact check: Gold prices are LBMA Gold Price afternoon fixes to 25 September 2026 and spot quotes from 28 September 2026. Other data: World Gold Council, the US Federal Reserve, the ECB, the Bank of England, the US Treasury, FRED, Schroders, J.P. Morgan Asset Management, Barclays Private Bank, Vanguard and the FCA, as of 28 September 2026. Past performance is not a reliable guide to future returns.
Frequently asked questions
Is it too late to buy gold after a record high?
Gold is not at a record now: on 25 September 2026 it was 21.2% below its January peak. After the 1980 and 2011 peaks it took almost 28 and almost 9 years to get back above them, and after 2020 about 3.4 years. It is too late only for a plan that needs a quick rebound.
Should I wait for gold to fall before buying?
Waiting is a guess as well. Gold fell 26.1% from its record to the July low, then rose about 17% by late August. A buyer who treated the first benchmark price more than 10% below the record, on 2 February 2026, as the bottom was still about 9.6% down on 25 September. Fixed buying dates remove the guess.
Is gold worth buying when stocks are also near record highs?
It can be, as a small share for diversification. In US dollars gold fell in 2026 while the S&P 500 rose, and in the WGC’s 20-year example a 5% gold share lowered both the portfolio’s swings and its worst fall. Holding both spreads risk; it does not remove it.
How much of my portfolio should be in gold?
There is no single right number. The WGC tests 2.5% to 10% and uses 5% as its worked example. Keep 3 to 6 months of outgoings in cash first, and if you trade gold with leverage, stay within the FCA’s guide of no more than 10% of net assets in high-risk investments.
What could make the gold price fall?
The WGC’s mid-year outlook named these risks: “US dollar strength and rates rising beyond current expectations”, a shift into riskier assets and “a marked deceleration in central bank buying”. In 2026 some analysts linked the 30 January drop to a rising dollar, and rates rose in September.
What is the easiest way to buy gold with a small amount?
On Volity you can trade gold as a CFD on XAU/USD or XAU/EUR from a commission-free Markets account that starts from $1, with funding from EUR 10. A CFD gives you the price move, not the metal, and positions held past 22:00 GMT pay or earn an overnight fee. To own metal for years, compare physical gold and gold ETFs.