In finance, the XAU meaning is one troy ounce of gold: XAU is gold’s code in ISO 4217, the international list of currency codes, where X marks a unit that belongs to no single country and Au is the chemical symbol for gold. XAU/USD is the price of that one ounce in US dollars, so a quote of 4,100.00 means an ounce costs $4,100 and every $1 move changes the value of each ounce you hold by $1.
TL;DR: XAU is one troy ounce of gold. XAU/USD is the number of US dollars one ounce costs. Profit or loss is ounces times the price change, so 10 ounces and a $25 rise make $250. Real interest rates, the dollar and central-bank buying drive most moves. On Volity you trade XAU/USD and XAU/EUR as CFDs, long or short, 24/7.
Below: the code, the quote, other gold prices, what moves XAU/USD, and a worked trade you can check by hand.
What XAU means in the ISO currency list
ISO 4217 is the international standard that gives each currency a three-letter code, such as GBP, EUR and USD. SIX maintains the list for ISO and publishes it as a downloadable code file. In that file gold has its own entry: currency name “Gold”, code XAU, numeric code 959. Its minor unit column reads “N.A.”, because gold has no official smaller unit the way a pound has pence.
Codes that start with X belong to no single country. The other two letters come from Au, the chemical symbol for gold, from the Latin word aurum. So XAU reads as “gold, not a national currency”. SIX describes its work on these codes on its financial data standards page.
The unit behind the code is the troy ounce, the traditional weight for precious metals. It is about 31.1 grams, a little heavier than an ordinary ounce. The World Gold Council’s gold price data follows the same convention: prices are per troy ounce unless stated otherwise.
How XAU/USD is quoted and how a $1 move adds up
A currency pair has two parts. The first code is the base, the thing being priced. The second is the quote currency, the money it is priced in. In XAU/USD the base is one ounce of gold and the quote currency is the US dollar. A price of 4,100.00 says one ounce costs 4,100 US dollars.
For scale, the World Gold Council’s Gold Demand Trends Q3 2026 puts the average LBMA Gold Price, the main gold benchmark, at US$4,262 per ounce in the third quarter of 2026, 23% higher than a year earlier. Treat it as a dated reference point, not a live quote. The 4,100.00 used in the examples below is illustrative.
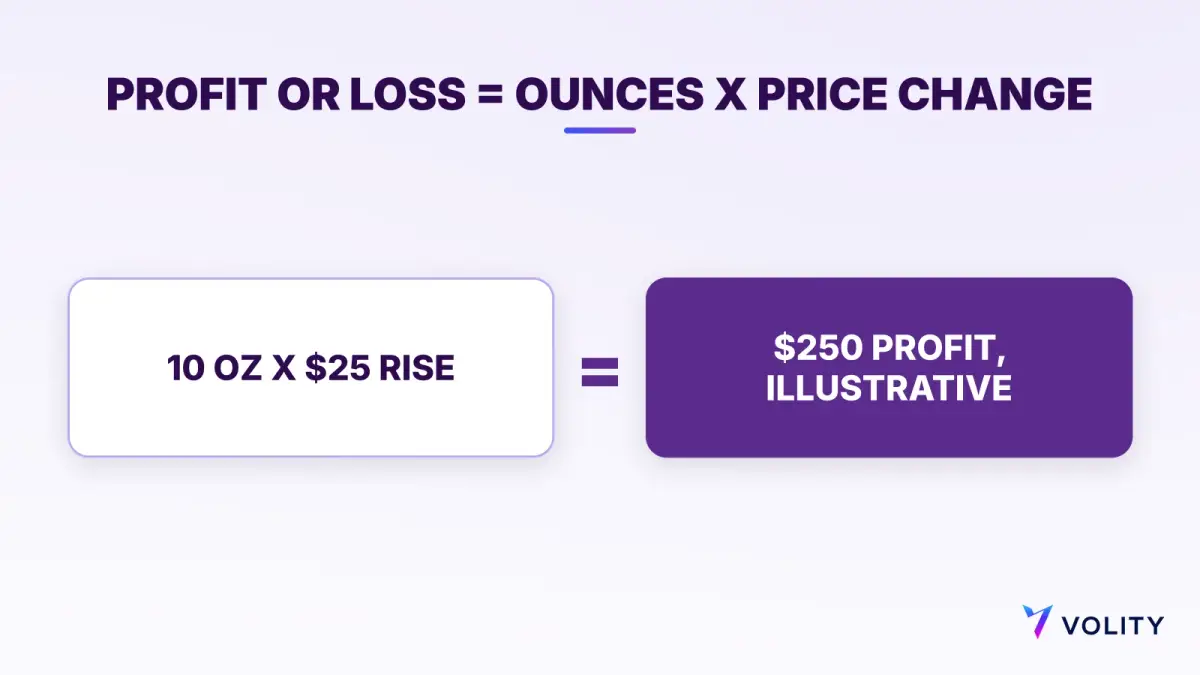
The arithmetic is short. Profit or loss in dollars equals ounces times the price change in dollars.
| Position (illustrative) | Price change | Result in dollars |
|---|---|---|
| 1 ounce, long | $1 rise | $1 profit |
| 10 ounces, long | $1 rise | $10 profit |
| 10 ounces, long | $25 rise, 4,100.00 to 4,125.00 | $250 profit |
| 10 ounces, long | $30 fall, 4,100.00 to 4,070.00 | $300 loss |
Every platform shows two prices. The sell price (the bid) is slightly lower than the buy price (the ask), and the gap between them is the spread. A long opens at the ask and closes at the bid, so the price must move past the spread before the trade shows a profit.
XAU next to XAG, XPT, XPD and other gold prices
The same ISO list gives codes to three other precious metals: XAG for silver (961), XPT for platinum (962) and XPD for palladium (964). Each means one troy ounce of the metal, so XAG/USD is the dollar price of an ounce of silver.
XAU/EUR is the price of one ounce in euros. It moves with gold and with the euro-dollar rate, because most gold trading is priced in dollars. Roughly, XAU/EUR equals XAU/USD divided by EUR/USD. Say EUR/USD stood at 1.10, a hypothetical figure: an ounce at 4,100 dollars would cost about 3,727 euros. The ECB euro reference rate gives the daily EUR/USD figure.
Other gold prices measure the same metal in different ways.
| Price | What it is | How often it updates |
|---|---|---|
| XAU/USD spot quote | Dollars per ounce for immediate delivery, quoted by dealers and brokers | Continuously |
| LBMA Gold Price | Benchmark set in electronic auctions at 10:30 and 15:00 London time, in US dollars | Twice a day |
| COMEX gold futures (GC) | Exchange contract for 100 troy ounces with a set expiry date | While the exchange is open |
| XAU/USD CFD | Contract that tracks the spot price; you settle the price difference and own no metal | As the broker quotes it |
Many contracts and valuations use the LBMA Gold Price as their reference. The LBMA states that ICE Benchmark Administration runs it independently, in line with the IOSCO principles for financial benchmarks. IBA’s own page lists the auction times and confirms the price is formed in US dollars.
A COMEX gold futures contract, symbol GC, covers 100 troy ounces under CME Group’s rulebook, so a $1 move changes one contract’s value by $100. The guide to gold futures contracts covers margin and expiry.
What moves XAU/USD: real rates, the dollar and central banks
A small group of forces explains most moves on the chart, and they often pull in different directions.
Real interest rates
A real interest rate is a bond yield after inflation. Gold pays no interest, so holding it means giving up that yield. When real yields rise, holding gold costs more, which tends to weigh on the price; when they fall, the opposite tends to happen. The US Treasury publishes daily real yield curve rates, and the Bank of England publishes real gilt yield curves for the UK.
The US dollar
A stronger dollar means an ounce costs fewer dollars, all else equal, and a weaker dollar means it costs more. The dollar’s reach is wide: the BIS Triennial Survey found that in April 2022 foreign exchange turnover averaged $7.5 trillion a day, with the dollar on one side of 88% of trades. The Federal Reserve’s H.10 release tracks it against major currencies.
Central-bank and fund buying
Central banks are large, steady buyers. World Gold Council central-bank figures show purchases of 321 tonnes in the third quarter of 2026, 42% more than a year earlier and well above the five-year quarterly average of 227 tonnes. Year-to-date buying reached 675 tonnes. Its reserves by country data shows who holds the most.
Investment funds matter too. In the same quarter, gold ETFs (exchange-traded funds that hold metal for their investors) took in 211 tonnes, lifting total holdings to a record 4,256 tonnes. The World Gold Council links those inflows to “mounting concerns over fiscal sustainability and inflation, among other things”.
Risk events
Wars, banking stress, elections and surprise central-bank decisions can move gold in minutes. These moves cut both ways: gold can drop quickly once fear fades, and it has gone through long stretches of falling or flat prices. For timing after big rallies, read whether now is a good time to buy gold.
When XAU/USD trades and when it moves most
Dealers in London, New York and Asian centres trade it with each other directly, so a quote exists far beyond any one exchange’s hours. On Volity, gold is among the markets that trade 24/7, while forex trades 24/5.
Moves tend to be larger when London and New York are both open, around the LBMA auctions at 10:30 and 15:00 London time, and when major US inflation or jobs data comes out. Quieter hours bring smaller moves but thinner prices. Check the economic calendar before you trade, and see the best time to trade gold for each session.
How to trade XAU/USD on Volity
On Volity, spot gold trades as a CFD in two forms, XAU/USD and XAU/EUR, from the same account that holds forex, indices, commodities and crypto. A CFD, or contract for difference, settles the change in price between opening and closing a trade. You own no metal, so you can go long (gain if the price rises) or short (gain if it falls) with the same ease. The gold trading platform page shows the product.
Leverage lets you open a position larger than the money you set aside, which is called margin. On Volity, leverage on metals goes up to 1:500. Leverage magnifies losses exactly as much as gains; it changes how fast an account moves, not the odds of a trade. The guide to leverage in gold trading covers the trade-offs.
Regulators in some regions set their own caps for retail clients of the firms they supervise. ESMA’s 2018 CFD measures set a 20:1 limit on gold for retail clients in the EU. The FCA’s PS19/18 rules require 5% margin on gold for UK retail clients, the same 1:20 ratio. Both are rules for those regulators’ retail markets.
A worked example with illustrative numbers
Say XAU/USD is quoted at 4,100.00 and you buy 10 ounces. The example is hypothetical and the prices are illustrative.
- Position value: 10 x $4,100 = $41,000.
- Margin at 1:500, for illustration: $41,000 / 500 = $82. The platform shows the actual margin before you confirm.
- Price rises to 4,125.00: the move is $25 per ounce, so the long gains 25 x 10 = $250.
- Price falls to 4,070.00: the move is $30 per ounce, so the long loses 30 x 10 = $300.
- A short of 10 ounces at 4,100.00 mirrors this. It gains $300 if the price falls to 4,070.00 and loses $250 if it rises to 4,125.00.
The example leaves out costs. Each trade pays the spread, which on Volity is dynamic and shown live on the platform. A position held past 22:00 GMT may also pay or receive an overnight amount. The Markets account is commission-free, and the full schedule is on the charges and fees page.
Placing your first XAU/USD trade, step by step
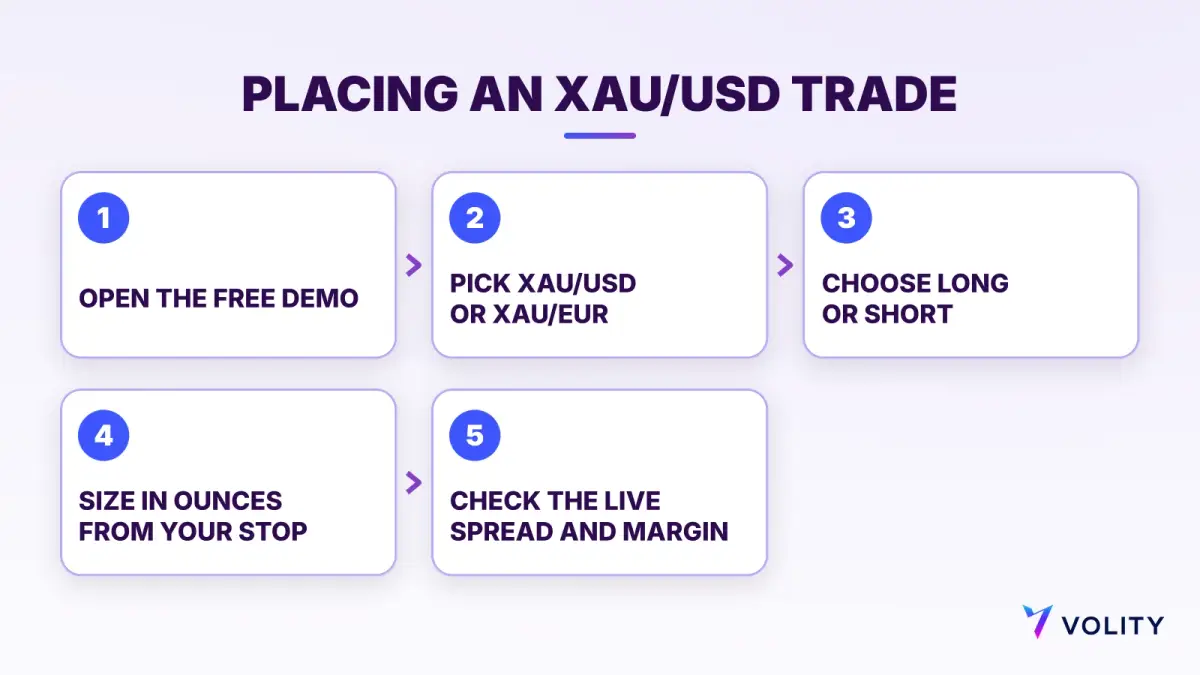
- Open a free demo account. It shows the live XAU/USD quote and spread with no money at risk.
- Search for XAU/USD, or XAU/EUR if you think in euros, and open its chart.
- Pick a direction: buy (long) if you expect a rise, sell (short) if you expect a fall.
- Set the size in ounces from the amount you are willing to lose, not from the margin available. The position size calculator turns a risk amount and a stop distance into a size.
- Add a stop-loss, the price at which the platform closes the trade to cap the loss.
- Check the margin and the live spread on the order ticket, then confirm.
- Work out the result with ounces x price change, and repeat on the demo until it feels routine.
Reading an XAU/USD chart
The vertical axis of an XAU/USD chart is dollars per ounce. Each candle covers one period, such as an hour or a day, and shows the open, high, low and close. Usually a green or hollow body means the price closed higher, and a red or filled body means it closed lower.
Turn every distance on the chart into money before you act. Say the price sits at 4,100 and your stop is at 4,080: the distance is $20 an ounce. On 5 ounces that stop risks $100. Working backwards, someone willing to risk $100 with a $20 stop would trade 5 ounces. In this hypothetical, size comes from the stop distance, not from the leverage available.
Charts also show support (a floor where the price has turned up before) and resistance (a ceiling where it has turned down). They are zones, not exact lines, and gold often overshoots them on news. The gold trading strategies guide combines these levels with the drivers above. Compare providers with the best gold trading platforms or browse the gold hub.
In practice: XAU is one ounce of gold, XAU/USD is its dollar price, and every trade comes down to ounces times dollars moved. Know that number before you click, and size from your stop, because leverage makes losses arrive as fast as gains.
Fact check: ISO 4217 codes from the SIX list one file (17 September 2026). LBMA Gold Price details from the LBMA and ICE Benchmark Administration. Demand and central-bank figures from the World Gold Council, Gold Demand Trends Q3 2026. Retail leverage rules from ESMA (2018) and FCA PS19/18 (2019); FX turnover from the BIS (April 2022). Checked 10 November 2026.
Frequently asked questions
Why does gold have a currency code?
Banks, payment systems and trading platforms run on ISO 4217 codes. Giving gold the code XAU (numeric 959) lets the same systems quote, book and settle it like money. The X shows it belongs to no country, and Au is gold’s chemical symbol.
Is XAU the same as XAU/USD?
No. XAU is the unit, one troy ounce of gold. XAU/USD is a price: the number of US dollars one ounce costs. XAU/EUR is the same ounce priced in euros.
How much is 1 XAU worth?
One XAU is worth whatever one troy ounce of gold costs at that moment. The LBMA Gold Price averaged US$4,262 an ounce in the third quarter of 2026, according to the World Gold Council. Check a live quote for today’s figure.
Can you buy XAU?
You can buy physical gold from a dealer, or trade the price of XAU. On Volity you trade XAU/USD and XAU/EUR as CFDs, long or short, with no metal to own or store.
Is XAU/USD forex or a commodity?
Both labels are used. The underlying is a commodity, gold, but it is quoted like a currency pair, with a base and a quote currency, so many platforms list it next to forex pairs.
Is XAU/USD the same as gold futures?
No. An XAU/USD quote is a spot price for one ounce with no expiry. A COMEX gold futures contract (GC) covers 100 troy ounces and expires on a set date, and its price usually sits a little away from spot because of interest and storage costs.