A Doji candle forms when price opens and closes at nearly the same level. Buyers try to push the market up. Sellers try to bring it back down. Neither side holds control. That is why the candle body appears flat or extremely narrow.
In forex trading, a Doji often appears near key levels. Traders view it as a sign of hesitation. Some wait for confirmation before acting. Others use it to mark possible reversals or exhaustion zones. But the core signal lies beyond the body.
The wick range shows how far price moved before closing flat. It stretches from the highest point to the lowest point during the session. That range captures the emotional extremes of both sides.
You can use the wick range to understand market pressure. A wider range suggests stronger rejection or volatility. A narrow one suggests weaker movement. Traders use this detail to plan entries, set stops, and time exits more accurately.
While understanding Wick Range of a Doji Candle is important, applying that knowledge is where the real growth happens. Create Your Free Forex Trading Account to practice with a free demo account and put your strategy to the test.
Why Wick Range Matters in a Doji Candle
It should be clear that a Doji candle forms when the market fails to pick a clear direction. Price opens and closes at nearly the same level. That creates a small body. Novice Forex traders focus on the shape of that body but the true signal lies in the wick.
The wick shows the highest and lowest points reached during the session. It reveals the range of movement caused by buyers and sellers. That movement reflects the intensity of the battle. You can read volatility, pressure, and sentiment from it.
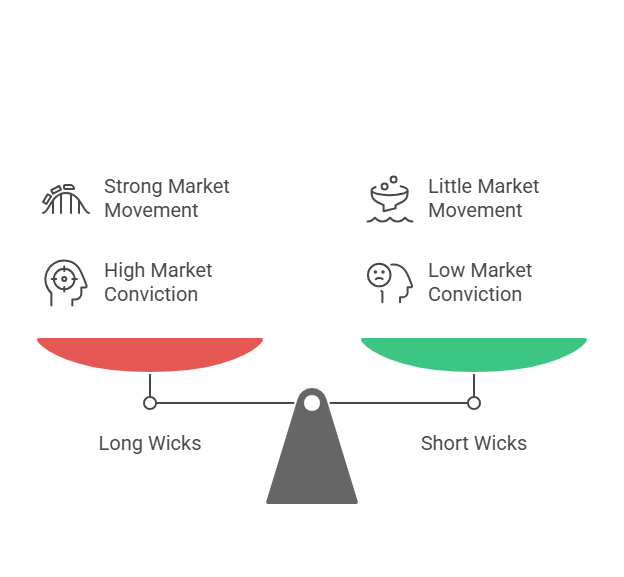
A long wick means both sides attempted to dominate. Neither succeeded. That suggests high volatility with no clear trend. A short wick means the price stayed close to the open. That shows calm conditions and limited pressure from both sides.
Most Doji patterns appear near reversal zones. You need to know where rejection happened. The wick provides that information. For example, a long upper wick near resistance shows buyers failed to hold their gains. That often signals a bearish reversal. A long lower wick near support suggests sellers failed to break the zone. That signals potential strength.
Price charts contain many Dojis. Not every one carries value. You need to measure the wick range to understand if the indecision matters.
What Does the Wick Range Actually Measure?
The wick range measures the full distance between the highest and lowest prices during a candle’s life. You find it by subtracting the low from the high. In a Doji candle, that range tells the whole story.
The body becomes nearly invisible when the open and close are equal. That makes the wick range the only part that reflects price action. It shows how far the market moved before returning to balance. This detail connects directly to the broader family of candlestick patterns, which place Dojis in context with other signals. You see the emotional extremes of buyers and sellers in that span.
For example, consider a Doji that forms on the USD/JPY one-hour chart. Price opens at 156.40 and closes at 156.42—almost flat. During the session, price rallies to 156.80 and drops to 156.00. The wick range is 80 pips. That movement tells you buyers tried to break higher. Sellers pushed back with equal force. The market closed undecided.
Now take a different Doji. The same pair opens at 156.40, closes at 156.39, hits a high of 156.45, and a low of 156.34. The wick range is just 11 pips. That shows weak momentum. Buyers and sellers barely tested each other.
You need to watch this range to judge intensity. A wide wick range marks a volatile session where neither side wins. A narrow one signals lack of effort or interest. In both cases, the body tells you nothing. The wick reveals everything.
How Wick Length Signals Strength of Indecision or Reversal?

Wick length shows more than just price movement. It reveals how strong each side acted before the price settled. In a Doji, where the open and close are nearly equal, the wick becomes the main signal.
A long wick reflects forceful rejection. Buyers pushed prices higher. Sellers slammed it back down. Or the reverse happened. Either way, the market tested a level and failed to hold. That often appears before a reversal. For example, in EUR/USD, price opens and closes near 1.0880. The candle stretches up to 1.0920 and drops to 1.0840. A 40-pip wick above and below. That shows aggressive trading from both sides. Reversal becomes likely if the move ends near support or resistance.
A short wick means price stays near the open. The session lacked movement or conviction. You might see this in slow markets or before major news. For instance, GBP/USD opens and closes near 1.2740. High is 1.2750. Low is 1.2732. The wick range is only 18 pips. That suggests little interest or hesitation—not strong enough to act on.
Balanced wicks—when upper and lower wicks are similar—signal a tug-of-war. Buyers and sellers each tried to move the price. Neither gained control. This creates a classic indecision Doji. It may lead to a reversal if it forms near a key level.
One-sided wicks suggest dominance. A long upper wick with no lower wick shows buyer exhaustion. Sellers took control. That often hints at a bearish turn. A long lower wick with no upper wick suggests seller rejection. Buyers stepped in strongly. That signals possible bullish reversal.
You can read wick length like market pressure. Long and uneven wicks show violent rejection. Short and balanced ones show calm uncertainty. Each version prepares you for a different kind of market response.
Ready to Elevate Your Trading?
You have the information. Now, get the platform. Join thousands of successful traders who use Volity for its powerful tools, fast execution, and dedicated support.
Create Your Account in Under 3 MinutesWhat is the Wick Range Across Doji Variations?
Not all Doji candles show the same kind of indecision. Each variation comes with a different wick range. That wick range shifts the market’s message. You need to compare them to understand how sentiment changes.
Long-Legged Doji: Wide Range on Both Sides
The long-legged Doji has extended upper and lower wicks. Price swings sharply in both directions. Buyers test highs. Sellers test lows. Neither side holds control.
This type forms when market emotions run high. For example, in AUD/USD, price opens and closes at 0.6620. High hits 0.6680. Low drops to 0.6560. That 120-pip wick range reflects major volatility. Both sides showed strength—but ended flat. It suggests a strong tug-of-war and warns of a likely breakout.
Dragonfly Doji: Long Lower Wick Only
The Dragonfly Doji shows a long lower wick with no real upper wick. Price opens high, drops sharply, then recovers. It closes near the open. Sellers dominated early, but buyers took control by the end.
That long lower wick signals rejection of downside pressure. For instance, if GBP/JPY opens and closes near 183.50, but the low touches 182.20, the wick range shows a failed breakdown. Traders may expect a bullish reversal, especially near support. In multi-candle formations, this setup often appears as the doji in morning star pattern, which blends hesitation with a strong bullish recovery.
Gravestone Doji: Long Upper Wick Only
The Gravestone Doji does the opposite. It opens low, pushes up, but fails to hold gains. Price closes near the open. That creates a long upper wick.
The wick tells you buyers tried to take control—but lost it. This often signals weakness. If EUR/CHF opens and closes at 0.9670, but hits a high of 0.9725, that 55-pip upper wick warns of reversal. It becomes stronger when it forms near resistance.
Four Price Doji: No Wick at All
The four price Doji has no wick. The open, close, high, and low are all the same. The market did not move. That signals complete indecision—or zero interest.
You might see this during low-volume sessions or before news events. In pairs like USD/CAD, if price stays at 1.3610 the entire session, traders avoid risk. Wick range is zero. That suggests silence rather than struggle.
So, you should know that each Doji variation uses wick range to reveal trader behavior. The wider the wick, the louder the sentiment. Long wicks reflect failed attempts. Short or missing wicks signal hesitation. You need to read that difference before you act.
How to Read and Trade Doji Wick Ranges in Real Charts?

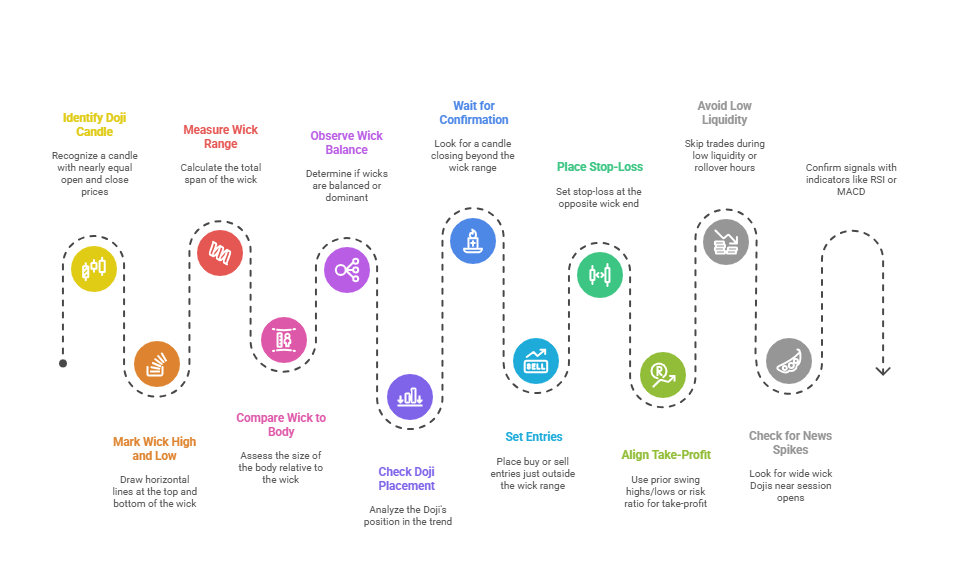
- Identify the Doji Candle Clearly
Make sure the open and close prices are nearly equal. Ignore candles with large bodies. Only true Dojis can reveal meaningful wick behavior - Mark the High and Low of the Wick
Draw horizontal lines at the top and bottom of the Doji’s wick. All these levels become your temporary resistance and support zones. - Measure the Wick Range (High – Low)
Calculate the total wick span. Large ranges show strong buyer–seller conflict. Small ranges suggest weak interest. A 40-pip wick range in GBP/JPY is significant; a 10-pip range in EUR/USD is neutral or flat. - Compare Wick Length to Body Size
The smaller the body in relation to the total candle size, the stronger the market indecision. If the body is 5% of the full range, that candle signals high tension between both sides. - Observe Wick Balance or Dominance –Equal-length wicks on both sides = neutral indecision. Long upper wick only = buyer failure (bearish signal). Long lower wick only = seller failure (bullish signal). A 1:3 wick ratio shows strong directional rejection.
- Check the Doji’s Placement in the Trend – Doji after a sharp uptrend with long upper wick → bearish reversal likely. Doji after a steep downtrend with long lower wick → bullish reversal likely. Mid-range Doji with short wicks = indecision, not trade-worthy.
- Wait for Confirmation After the Doji –Look for a candle that closes beyond the wick range. A close above the upper wick confirms a buy. A close below the lower wick confirms a sell. Never trade the Doji alone.
- Set Entries Just Outside the Wick Range
Buy entry = 1–2 pips above the upper wick and sell entry = 1–2 pips below the lower wick. See how this avoids false breakouts inside the range. - Place Stop-Loss at the Opposite Wick End – For buys, stop-loss goes below the low of the Doji wick whereas for sells, stop-loss goes above the high. This contains risk inside the original conflict zone.
- Align Take-Profit With Structure or Risk Ratio – Use prior swing highs/lows or 2x your stop distance. A Doji with a 30-pip wick and 10-pip body allows for a 20–30 pip target on breakout.
- Avoid Trades During Low Liquidity or Rollover Hours – Dojis with small wicks during late US or early Asian sessions often mean nothing. Wick range under 8–10 pips in majors = skip.
- Check for News or Session Open Spikes – Wide wick Dojis near London or NY open often precede major moves. Use wick breakouts for momentum trades if volume supports it.
- Use Indicators to Confirm Wick-Based Signals – RSI divergence, MACD turns, or a Bollinger Band rejection at the same time as a Doji wick form gives high-quality confirmation.
Wick Range on Higher Timeframes: What It Reveals on Lower Charts?
A Doji candle on a higher timeframe—especially daily or 4-hour—often marks hidden trading activity that becomes clear only when you zoom into lower timeframes like 1H, 15M, or 5M. The wick range of that higher-timeframe Doji reflects price volatility and rejection zones, even though the candle body is small.
According to ForexBee, a Doji represents market indecision and often appears during periods when neither buyers nor sellers dominate. However, when you switch to a lower timeframe, those same Doji candles often reveal a price range, defined by swing highs and lows. These wicks translate to the resistance and support levels that form the boundaries of that short-term range.
What the Wick Range Tells You on Lower Charts?

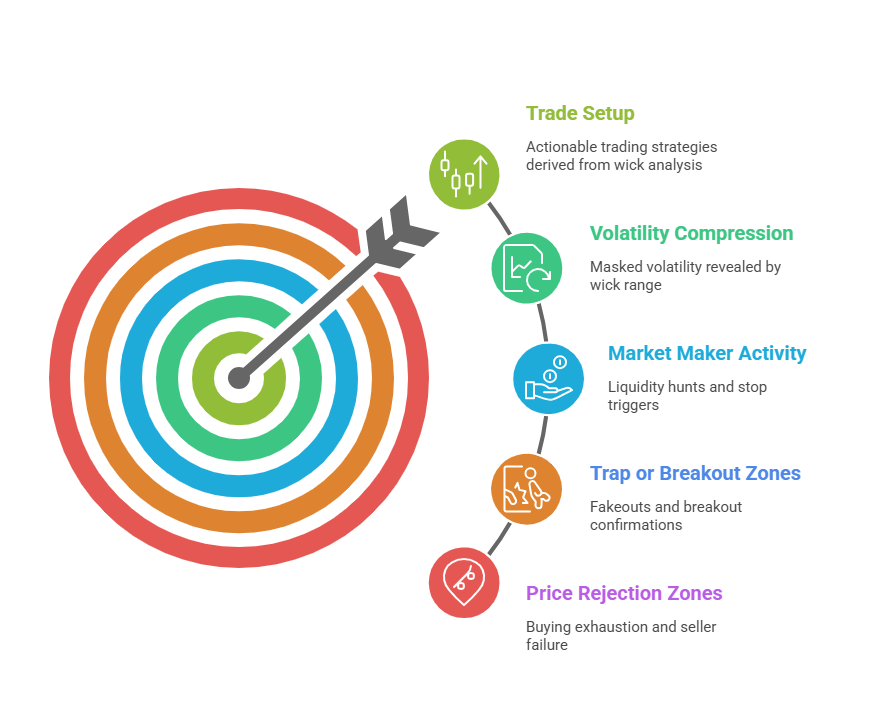
- Price Rejection Zones: The upper wick often marks buying exhaustion and acts as intraday resistance. The lower wick shows seller failure and sets up potential support. XS.com confirms this by noting that wick length signals rejection and indecision zones.
- Hidden Range Structure: A series of Dojis on the 4H or daily often translates into a clear consolidation box on the 15M or 5M chart. ForexBee illustrates this with examples from XAUUSD, GBPJPY, and ETHUSD, where long-wick candles became defined tradable zones after timeframe zoom-in.
- Trap or Breakout Zones: As Blueberry Markets points out, the wick range often sets up fakeouts—price briefly pierces above the wick, then reverses sharply. Traders mistake this for breakout confirmation and get trapped.
- Market Maker Activity: Wick extremes often align with liquidity hunts. According to Alchemy Markets, market makers drive price into these zones to trigger stops before reversing the move.
- Volatility Compression: In the higher timeframe, a Doji looks quiet. But the wick range on a lower chart may span 30–100 pips, especially in volatile pairs like GBPJPY or XAUUSD. The range is tradable but masked unless observed from a lower timeframe.
- Setup Cue for Intraday Traders: As explained by ForexBee, spotting a Doji on the 4H or daily chart can serve as a signal to drop down to 15M and look for a range setup or reversal signal, especially using tools like RSI or pin bars.
For example, on the daily XAUUSD chart, a Doji with long wicks appears. When you check the 15M chart, the price is bouncing between the high and low. All these boundaries become your intraday resistance and support levels, which allows you to trade the range while others stay undecided.
So? The wick range of a higher-timeframe Doji is not random. It defines key zones of emotional buying/selling, often translating into actionable trade setups on lower timeframes. Use the wick as a guide, not a mystery.
Wick Range vs. Volume: Confirming Strength of the Signal
| Wick & Volume Condition | Interpretation | Indicator Confirmation (RSI / MACD) |
| Long Wick + High Volume | Strong rejection, likely reversal. Confirms key support/resistance zone. | RSI divergence or overbought/oversold alignment confirms signal. MACD crossover supports trend change. |
| Long Wick + Low Volume | Possible fakeout, low conviction. Watch for re-entry into range or failed breakout. | RSI flat or unaligned. MACD lacks crossover or momentum shift—signal likely weak. |
Turn Knowledge into Profit
You've done the reading, now it's time to act. The best way to learn is by doing. Open a free, no-risk demo account and practice your strategy with virtual funds today.
Open a Free Demo AccountFinal Take
Wick range reveals the hidden battleground in every Doji. It shows where buyers tried to push up—and failed. It marks where sellers stepped in—and got rejected. Each wick tells a story of attempted control and emotional reversal.
You need to study it, not skip it. A Doji means nothing without context. Always ask: who entered that candle, and who got kicked out? Wick range gives the answer. Use it to map zones of pain, pressure, and potential setups. That’s how you turn indecision into opportunity.


