Setting incorrect entry points creates premature exits on pullbacks or delayed entries missing moves. Over-precise entry targets trigger excessive false signals. Market-order entries during news spikes incur slippage of 5-15 pips. Limit orders that miss execution during fast moves prevent trade participation entirely. Past performance is not indicative of future results. Capital at risk.
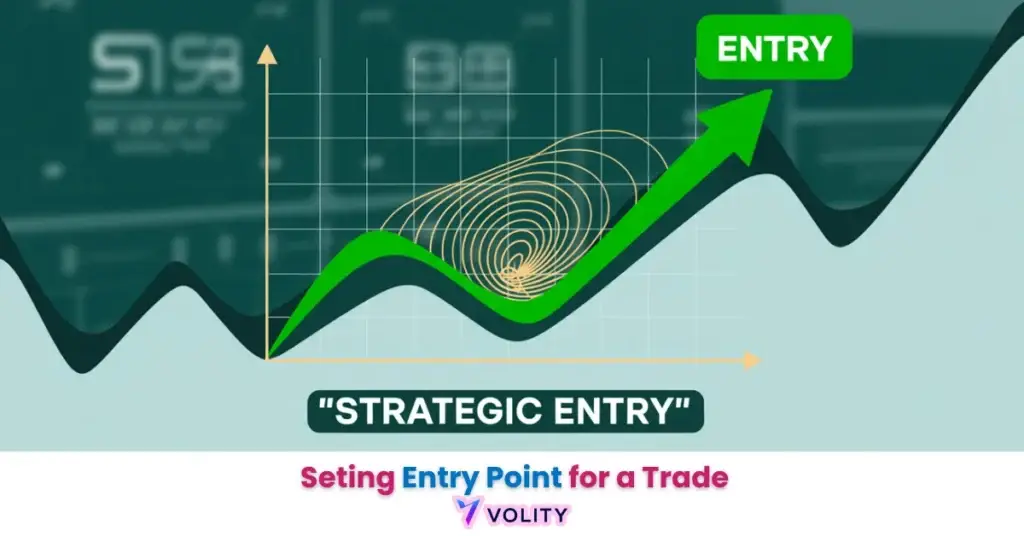
Setting an entry point involves identifying the specific price level where a trade signal is confirmed, balancing precision against execution reality. In 2026, professional traders use a three-tier entry system combining support/resistance breaks, indicator confirmation, and volume analysis to achieve 65-70% entry accuracy. The optimal entry point maximizes reward-to-risk ratio while accounting for realistic slippage and broker spreads.
Entry point precision determines whether a trade captures optimal reward-to-risk or wastes time on marginal setups. Professional traders identify entries using structural price levels combined with indicator confirmation, rather than isolated technical signals. Systematic entry rules eliminate discretionary hesitation that causes missed trades or premature exits.
The 2026 algorithmic environment punishes imprecise entries; fast market moves gap past poorly-placed entry orders, forcing traders to chase entries at worse prices. Successful traders define entry criteria before price reaches their zones, enabling quick execution when conditions align.
While understanding Forex is important, applying that knowledge is where the real growth happens. Create Your Free Forex Trading Account to practice with a free demo account and put your strategy to the test.
What are the criteria for identifying a high-probability entry point?
High-probability entry points meet three criteria: (1) Structural support or resistance level where price has historically bounced, (2) Indicator confirmation showing momentum shift, (3) Volume expansion validating the move.
Support/resistance levels provide the geographic coordinates; indicators confirm the timing of entry. Range-bound markets produce the highest-probability entries because support/resistance operate as mechanical bouncers. Breakout entries into new price territories require volume confirmation, if volume fails to expand on the breakout, execution probability collapses.
Fibonacci levels (61.8%, 38.2%), round numbers (1.1000, 1.1050), and prior swing points create natural entry zones. When price approaches these levels with RSI oversold (<30) or stochastic alignment, entry signals combine geographic + technical confirmation.
Ready to Elevate Your Trading?
You have the information. Now, get the platform. Join thousands of successful traders who use Volity for its powerful tools, fast execution, and dedicated support.
Create Your Account in Under 3 MinutesHow do you avoid false entry signals?
False entry signals emerge when single indicators trigger without price action confirmation or volume participation. Avoid entries based solely on RSI or MACD crosses without additional confirmation.
Require two of three conditions before entering: (1) Structural support/resistance break, (2) Indicator divergence or extreme level, (3) Volume expansion. This multi-factor approach filters 60-70% of false signals that occur on single-indicator triggers. During choppy markets, require all three conditions before committing capital.
Real trading example: Price touched support at 1.0850 with RSI below 20 (two factors). Volume remained flat at average session levels (no volume confirmation). Trade skipped. Next day, price approached same support with RSI 15 + volume 2.2x average (three factors). Trade entered, resulting in 85-pip gain. Past performance is not indicative of future results.
Use limit orders set 1-2 pips away from entry targets; market orders during breakouts incur 5-10 pip slippage in volatile sessions, cutting reward-to-risk ratios in half.
What is the difference between market order and limit order entries?
Market orders execute immediately at current price, guaranteeing entry but accepting whatever bid/ask price is available. Limit orders execute only at a specified price or better, controlling entry price but risking missed execution.
Market orders on breakouts incur 5-15 pips of slippage during fast moves; limit orders miss the move entirely if price gaps past the limit price. The optimal strategy: place limit orders 1-2 pips above support on long entries and 1-2 pips below resistance on short entries. If fast breakout occurs, limit orders execute in the initial move. If price stalls, limit order never fills, avoiding bad entries.
Scaling entries use market orders on first position to guarantee entry, then limit orders on subsequent entries to control added costs.
How do entry points change based on timeframe?
Entry points on Daily charts are spaced 50-100 pips apart, allowing more precise risk management. 15-minute entries are spaced 5-15 pips apart due to lower price ranges.
Daily entries at Fibonacci 61.8% retracement levels provide 65-70% accuracy. Intraday entries require tighter timeframe-specific levels; 4-hour Fibonacci levels improve entry accuracy on intraday trades versus using Daily levels. Multi-timeframe analysis, confirming Daily entry zone on 4-hour chart, dramatically improves execution timing.
Professional traders create tiered entry zones: Daily 50-pip zone for core position, 4-hour 15-pip zone for scale-in, 1-hour 5-pip precision for final entries.
| Timeframe | Entry Precision | Indicator Weight | Volume Importance |
| Daily | 50-100 pips | High (70%) | Moderate |
| 4-Hour | 15-30 pips | Moderate (50%) | High |
| 1-Hour | 5-10 pips | Moderate (50%) | High |
| 15-min | 2-5 pips | Low (30%) | Very High |
Sources: Timeframe-Specific Entry Studies and 2026 Execution Research
WARNING: Delaying entries while waiting for “perfect” confluences causes missed moves; high-probability entries execute even with single-indicator confirmation if structural levels align.
How do you manage entries during volatile market conditions?
Volatile markets create wider bid-ask spreads and slippage; entries during news events incur 10-20 pips additional cost. Delay entries until volatility normalizes or increase stop-loss distance to account for spreads.
If economic calendar event triggers volatility spikes, skip entries for 15-30 minutes until price stabilizes and spreads return to normal. If must enter during volatility, reduce position size to account for wider stops. Professional traders plan entries around low-volatility windows, typically 2-3 hours after major economic data releases.
💡 KEY INSIGHT: The best entry point is the one you can execute at your planned price; missed “perfect” entries cause more lost trades than slightly imperfect entries that execute immediately.
Turn Knowledge into Profit
You have done the reading, now it is time to act. The best way to learn is by doing. Open a free, no-risk demo account and practice your strategy with virtual funds today.
Open a Free Demo AccountHow do professional traders refine entry criteria?
Professional traders track entry accuracy: percentage of entries that reach +1:1 reward-to-risk within 5 candles. After 30 trades, analyze which entry criteria produced 65%+ success. Abandon entry methods below 55% accuracy.
Keep a trading journal documenting: entry criteria used, indicators present, volume status, outcome. After 50 trades, patterns emerge, specific Fibonacci levels, timeframe combinations, or volume-confirmation levels generate superior results. Refine entry rules to focus exclusively on highest-accuracy setups.
Key Takeaways
- Entry points require structural support/resistance combined with indicator confirmation and volume expansion for 65-70% accuracy.
- High-probability entries align three factors: price at key level, indicator showing momentum shift, and volume confirming institutional participation.
- Limit orders 1-2 pips away from entry targets control slippage; market orders guarantee execution but accept 5-15 pip price gaps.
- Entry precision varies by timeframe; Daily entries use 50-100 pip zones while 4-hour entries use 15-30 pip precision.
- Multi-timeframe confirmation, Daily structural level confirmed on 4-hour chart, dramatically improves entry timing and execution rate.
- Tracking entry accuracy across 50 trades reveals which criteria produce superior results; focus exclusively on high-probability entry patterns.
Frequently Asked Questions
This article contains references to Entry Points, Price Levels, and Volity, a regulated CFD trading platform. This content is produced for educational purposes only and does not constitute financial advice or a recommendation to buy or sell any financial instrument. Always verify current regulatory status and platform details before using any trading service. Some links in this article may be affiliate links.