Quick answer
Crypto trading charts show a coin’s price over time and are the foundation of technical analysis. Candlestick charts are the most common, displaying the open, high, low and close for each period, while line and bar charts offer simpler views. Reading charts, with trend, support, resistance and volume, helps traders time entries and manage risk.
The Crypto Trading Starter Kit
A plain-English PDF: what to check before you trade, how orders and risk really work, and the mistakes to skip. Get it free.
This crypto trading charts guide starts with the basics: a crypto trading chart shows price and volume over time. Reading it well separates traders who guess from traders who set up trades on observable patterns. This guide covers candlesticks, the five most useful indicators, common patterns, and multi-timeframe analysis.
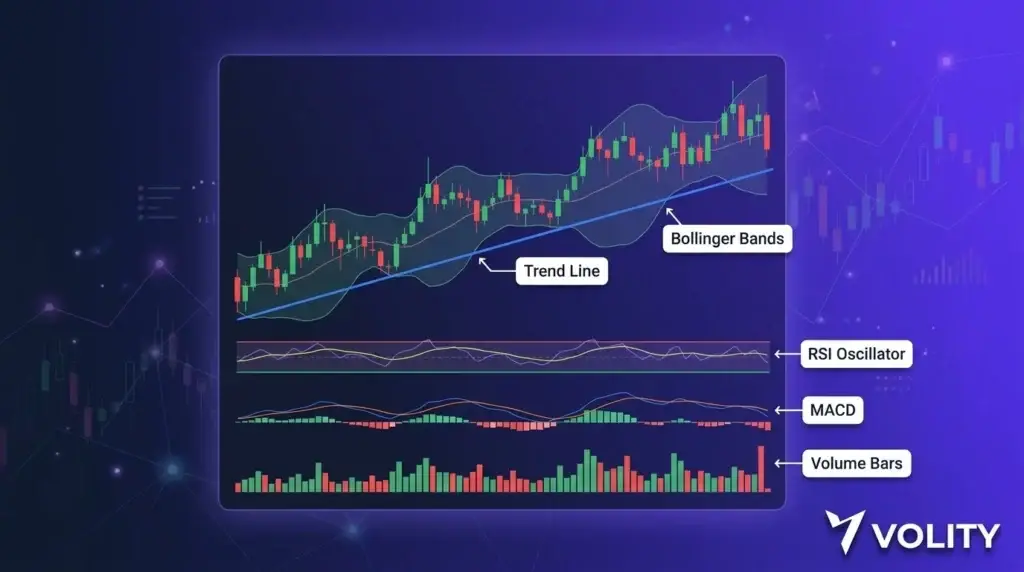
Candlestick basics. Each candle shows four prices for the period: open, high, low, close. Green (bullish) when close > open; red (bearish) when close < open. The body shows open-to-close; the wicks show high-to-close and low-to-open ranges. Time per candle is the timeframe (1m, 5m, 1h, 4h, daily).
Common candlestick patterns worth knowing: – Doji: open ≈ close, indicates indecision; reversal context matters – Engulfing: large candle engulfing the previous; trend-reversal signal – Hammer/Hanging man: long lower wick, small body; reversal indicator at trend extremes – Three-soldiers/Three-crows: three same-color candles in sequence; trend continuation
Top 5 indicators (the ones most professional retail uses):
- Moving averages (MA, EMA). 50 and 200 are the standard institutional levels. Price above 200MA generally bullish trend; below generally bearish.
- RSI (Relative Strength Index). Momentum oscillator. Standard 70/30 thresholds: above 70 = overbought (potential pullback); below 30 = oversold (potential bounce).
- MACD (Moving Average Convergence Divergence). Trend + momentum indicator. Signal-line crossover is a common entry trigger.
- Bollinger Bands. Volatility and mean-reversion. Touches of upper/lower bands signal extension; band squeezes signal upcoming expansion.
- Volume profile. Shows volume by price level. Identifies support/resistance more reliably than horizontal lines drawn by eye.
Multi-timeframe top-down workflow:
- Daily chart: identify the trend. Is the market trending up, down, or ranging?
- 4-hour chart: find a setup within the trend. Pullback to support? Breakout from range?
- 1-hour chart: refine entry timing. Where is the candle structure suggesting an entry?
- 15-minute chart: time the actual entry. Use limit orders or wait for a confirmation candle.
- Order ticket: stop-loss at 4-hour level, target at next major resistance.
This workflow combines trend direction, setup identification, and tactical entry timing in one cohesive view. Volity MT’s multi-chart capability lets you keep all four timeframes open simultaneously.
Common chart patterns:
- Head and shoulders / inverse H&S: reversal pattern at trend extremes
- Triangles (ascending, descending, symmetric): consolidation, expects breakout direction
- Flags and pennants: continuation patterns after sharp moves
- Cup and handle: bullish continuation pattern
- Double top / double bottom: reversal patterns
Each pattern has historical statistics on win rate and risk-reward. None work all the time; the value is having a framework to identify high-probability setups.
Volume in chart reading:
Volume confirms or contradicts price moves. Strong bullish move on high volume = real demand. Strong bullish move on low volume = possibly weak, suspect breakout. Volume divergence (price up, volume down) often precedes reversals.
What charts cannot do:
- Predict the future (charts show past data; pattern interpretation is probabilistic)
- Account for unexpected news (a great chart setup is meaningless if a major news event hits)
- Replace risk management (the best chart pattern can still fail; stops are non-negotiable)
The combination of chart reading + risk management + position sizing is what produces profitability. Chart reading alone is incomplete.
Where to learn deeper chart reading:
Build journal first. After 100 trades with detailed entry/exit notes, review which chart patterns and indicators correlate with your winning trades. Personalised pattern recognition built from your own data beats any generic course.
Key takeaways
Reading crypto trading charts is a probabilistic skill, not a deterministic one. The best crypto trading charts setups work 55-65% of the time when applied with proper risk management. Profitable crypto trading charts reading requires journal-backed pattern recognition built over months of practice.
Three foundations for crypto trading charts mastery:
- Multi-timeframe view (daily trend, 4h setup, 1h entry, 15m trigger) beats single-timeframe analysis
- Volume confirms or contradicts crypto trading charts price moves; combine the two
- Personalized pattern recognition built from your own crypto trading charts journal outperforms any generic course
Volity MT integrates TradingView charting natively for crypto trading charts analysis.
Sources
Related Volity crypto guides
- Benefits of Crypto Trading: 7 Real Advantages
- Crypto Trading Meaning: What It Is, 5 Forms
- Crypto Trading Tips: 12 Habits That Separate Profit
- Live Crypto Trading: Real-Time Execution on Volity
- Crypto Trading Volume Explained
- Crypto Day Trading Platform on Volity MT
- Crypto Trading Books: 10 Recommendations
- Can You Make Money Trading Crypto?
- Contract for Difference Trading Crypto: How CFDs Work
Frequently asked questions
How do I read a crypto trading chart?
Start with candlestick basics (OHLC, bullish/bearish). Layer on moving averages for trend. Add RSI or MACD for momentum. Use multi-timeframe view: daily for trend, 4h for setup, 1h for entry. Volume confirms moves.
Which indicators are best for crypto charts?
The five most useful: moving averages (50/200), RSI, MACD, Bollinger Bands, Volume Profile. Volity MT supports all natively plus custom Pine Script indicators.
What is the best timeframe to trade crypto?
Depends on style. Scalping: 1m-5m. Day trading: 5m-1h. Swing trading: 4h-daily. Position trading: daily-weekly. Multi-timeframe analysis combines them for top-down decisions.
Are crypto chart patterns reliable?
Patterns are probabilistic, not deterministic. The best patterns work 55-65% of the time. Profitability comes from pattern identification + risk-reward sizing + stops, not pattern alone.
Do I need a paid charting service for crypto?
No. Volity MT integrates TradingView charts for free with your account. 100+ indicators, custom Pine Script, multi-timeframe, drawing tools all included.
How long does it take to learn crypto chart reading?
First useful skills in 2-4 weeks of focused study. Pattern recognition that you can rely on: 3-6 months of journal-backed practice. Mastery (consistent decisions): years. Practice on demo while learning.
What do candlestick wicks mean?
Wicks (the lines above and below the body) show the high and low of the period. Long upper wicks often signal selling pressure; long lower wicks often signal buying pressure. Wicks at trend extremes are commonly reversal signals.