This innovative approach allows projects to launch tokens with built-in liquidity, ensuring a fair and transparent price discovery process from inception. It streamlines token distribution and provides a predictable pricing model for participants.
While understanding Bonding Curve in Crypto is important, applying that knowledge is where the real growth happens. Create Your Free Crypto Trading Account to practice with a free demo account and put your strategy to the test.
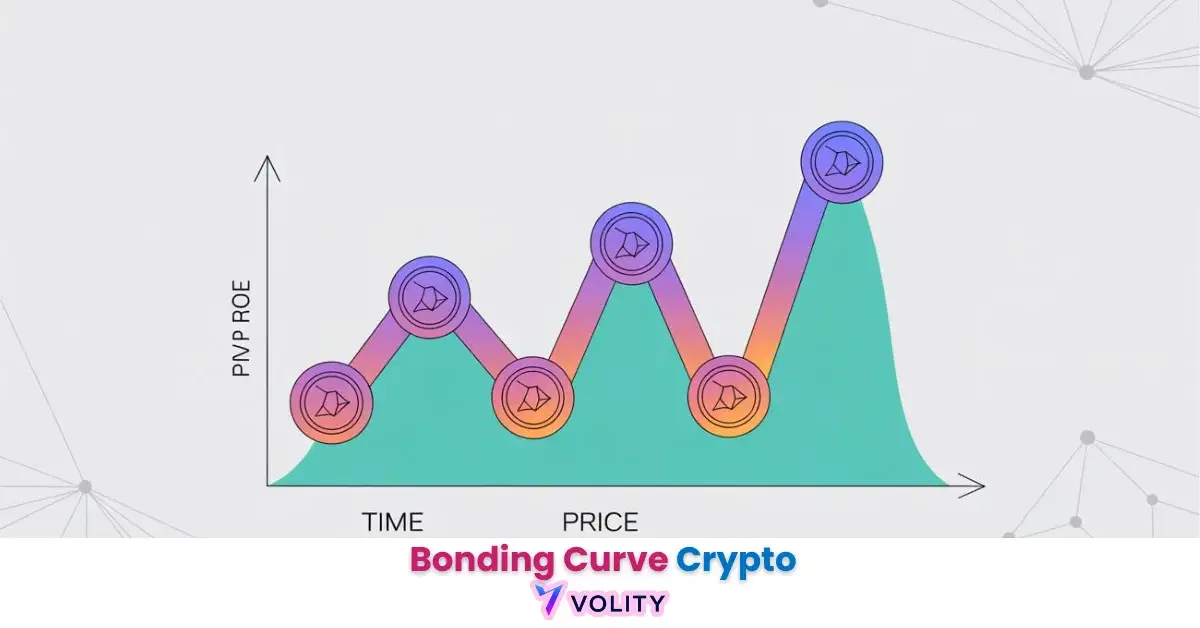
What is a Bonding Curve in Crypto?
A bonding curve in crypto is a fundamental smart contract mechanism that links a token’s price to its current supply via a predetermined mathematical function. This function, often represented as $y = f(x)$ (where ‘y’ is the price and ‘x’ is the supply), automatically adjusts the token’s value with every purchase or sale. The core function of a bonding curve is to provide continuous, automated liquidity and facilitate transparent price discovery for a new token.
Unlike traditional markets relying on buyers and sellers to meet at an agreed price, a bonding curve acts as a constant counterparty. It guarantees that a token can always be bought or sold directly from the contract itself. This ensures liquidity even for nascent projects with low trading volume, promoting stable and predictable token economics. The curve ensures that as more tokens are acquired, the cost for subsequent tokens steadily increases.
How Does a Bonding Curve Work?
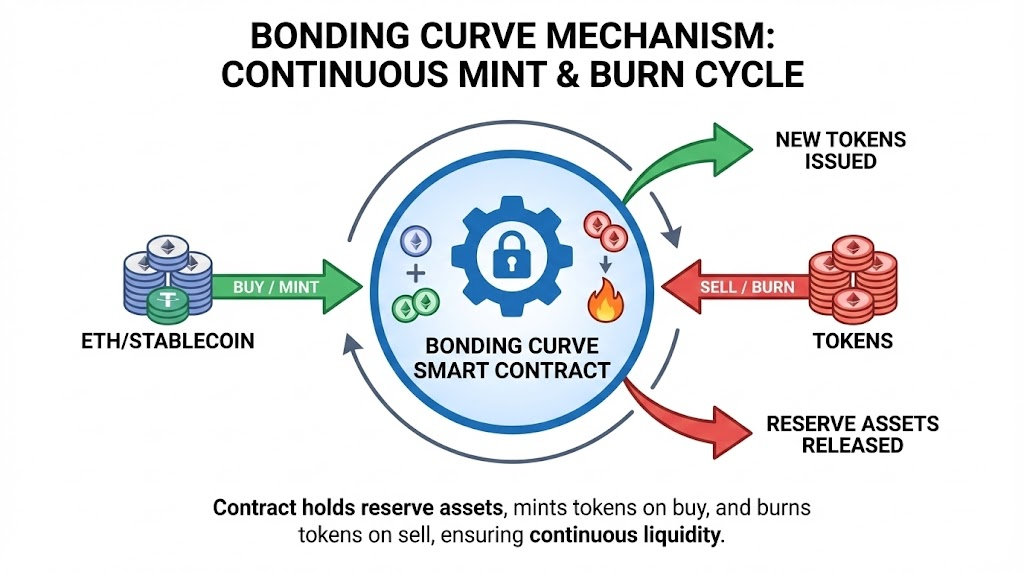
A bonding curve works by algorithmically adjusting a token’s price based on the current circulating supply managed by a smart contract. This intelligent contract functions as both a perpetual buyer and seller of the associated token. When users buy tokens, the contract automatically mints new tokens and increases the price according to the curve. Conversely, when users sell, the contract burns tokens, and the price decreases.
This two-way mechanism provides instant liquidity for the token, making it continuously tradable without needing a matching buyer or seller. The contract holds a reserve of a base currency (like ETH) or DAI, which backs the value of the issued tokens. Every transaction on the bonding curve directly impacts the token’s price, ensuring a dynamic and transparent market.
The Buy Function (Minting Process)
The buy function on a bonding curve initiates the minting process, where new tokens are created and issued to the purchaser. When a user sends the reserve currency (e.g., ETH) to the bonding curve’s smart contract, the contract calculates the new tokens’ price based on the current circulating supply and the curve’s formula.
It then mints the corresponding number of tokens and transfers them to the buyer. The reserve currency sent by the buyer is added to the contract’s liquidity pool, increasing the total value locked. This action increases the token’s circulating supply, which in turn causes the price of the next token to increase according to the curve’s mathematical function.
The Sell Function (Burning Process)
The sell function on a bonding curve initiates the burning process, where tokens are destroyed and the corresponding reserve currency is returned to the seller. When a user sends tokens back to the bonding curve’s smart contract, the contract calculates their value based on the current circulating supply. It then transfers the equivalent amount of the reserve currency from its pool to the seller. The tokens sent by the seller are then permanently removed from circulation, or “burned,” reducing the total supply. This decrease in supply causes the price of the next token to decrease, following the inverse action of the buy function.
Ready to Elevate Your Trading?
You have the information. Now, get the platform. Join thousands of successful traders who use Volity for its powerful tools, fast execution, and dedicated support.
Create Your Account in Under 3 MinutesTypes of Bonding Curve Models (Mathematical Formulas)
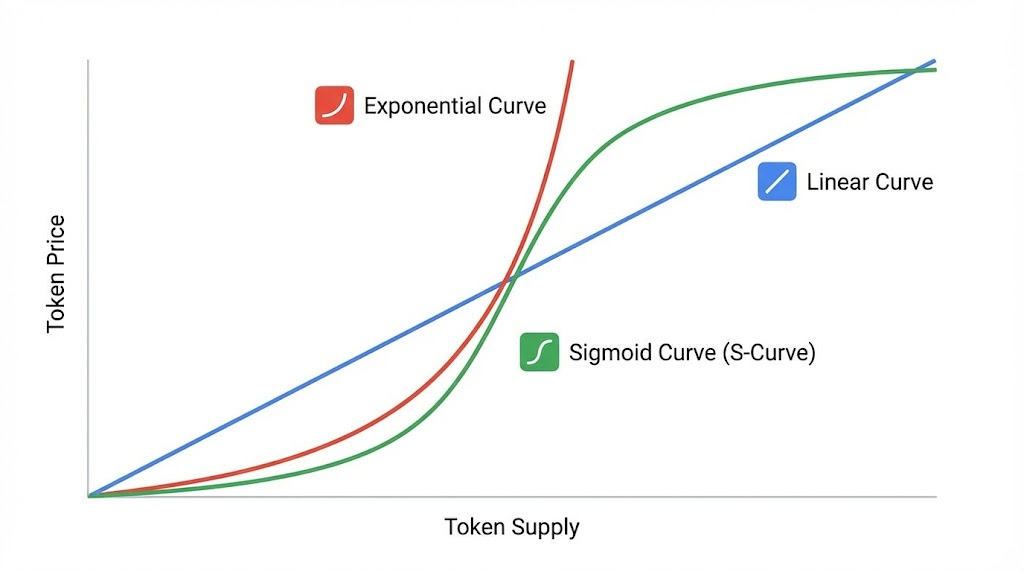
Bonding curves utilize different mathematical models to define the relationship between token supply and price, each resulting in distinct pricing behaviors. These models are crucial for designing tokenomics that align with a project’s goals. The three primary types of bonding curve models include Linear, Exponential, and Sigmoid curves.
Linear Bonding Curves (Steady Growth)
Linear bonding curves establish a direct and constant relationship between token price and supply, resulting in a steady, predictable price increase. The formula for a linear curve is typically expressed as:
$$P = m \cdot S$$
Where $P$ is price, $S$ is supply, and $m$ is the constant slope. This model ensures that each subsequent token purchased increases in price by a fixed increment. Linear curves are often chosen for tokens that aim for predictable growth and discourage speculative trading.
Exponential Bonding Curves (Aggressive Price Action)
Exponential bonding curves feature an accelerating price increase as the token supply grows, heavily rewarding early adopters. The formula for an exponential curve is commonly represented as:
$$P = S^n$$
This model drives aggressive price action, where the cost of each successive token rises dramatically faster than the previous one. Exponential curves are often employed in projects aiming to create strong early momentum and incentivize rapid initial adoption. However, they also carry higher risks of market volatility.
Sigmoid Bonding Curves (S-Curve Stabilization)
Sigmoid bonding curves, also known as S-curves, offer a more balanced price trajectory, characterized by an initial rapid rise, followed by a stabilization phase.
Sigmoid curves are ideal for projects seeking to reward early participation while also ensuring long-term price stability and preventing runaway valuations. They balance aggressive growth with eventual market maturity.
Advantages and Disadvantages of Bonding Curves
Bonding curves offer distinct benefits for token issuance and liquidity, but they also present specific risks. On the positive side, they provide instant and continuous liquidity and deterministic pricing. However, disadvantages include potential high volatility and the risk of front-running.
Benefits of Continuous Liquidity and Deterministic Pricing
Bonding curves provide continuous liquidity by ensuring a token is always available for purchase or sale directly from the smart contract. This eliminates reliance on external market makers. The deterministic pricing model ensures that the token’s price is always transparent and verifiable, calculated solely based on its circulating supply.
Risks of Front-Running and High Slippage
Front-running occurs when malicious actors observe pending buy orders and execute their own buy orders first at a lower price. Arbitrageurs constantly monitor bonding curves to correct price discrepancies between the curve and external markets.
Turn Knowledge into Profit
You've done the reading, now it's time to act. The best way to learn is by doing. Open a free, no-risk demo account and practice your strategy with virtual funds today.
Open a Free Demo AccountReal-World Applications of Bonding Curves
Bonding curves find practical utility in various decentralized applications, extending beyond simple token launches to more complex economic models.
Curation Markets and Decentralized Autonomous Organizations (DAOs)
Bonding curves are central to curation markets, which incentivize users to identify and promote high-quality information. For Decentralized Autonomous Organizations (DAOs), bonding curves can manage treasury funds, enabling members to buy into or sell out of the DAO’s governance token at algorithmically determined prices.
Meme Coin Launchpads (e.g., Pump.fun)
Meme coin launchpads, such as Pump.fun, use bonding curves to provide immediate liquidity and enable fair, decentralized token launches without pre-sales. What happens when a coin hits the bonding curve? Once a token reaches a specific market capitalization threshold (e.g., $69,000 USD), the bonding curve’s liquidity is automatically migrated to a decentralized exchange (DEX) like Raydium or Uniswap.
Bonding Curves vs. Traditional Order Books
Bonding curves and traditional order books represent fundamentally different mechanisms for price discovery. Traditional order books rely on buyers and sellers posting specific price requests. A trade only executes when a match occurs.
In contrast, bonding curves eliminate the need for matching orders. The smart contract itself acts as the counterparty. This provides instant execution but means price adjustments are continuous rather than discrete. Bonding curves enable projects to launch with guaranteed liquidity from day one.
Automated Market Makers (AMMs)
Automated Market Makers (AMMs) are protocols that facilitate asset exchange using liquidity pools. Bonding curves represent a specific type of AMM foundational design. While many modern AMMs use a “constant product formula” ($x \cdot y = k$), bonding curves also employ algorithmic pricing based on supply.
Key Takeaways
- Instant Liquidity: Bonding curves act as an automated counterparty, ensuring tokens can be bought or sold at any time directly through the smart contract.
- Deterministic Pricing: The price of a token is a direct result of its current supply and the underlying mathematical function, providing total transparency.
- Mint and Burn: Buying tokens mints new supply, while selling tokens permanently burns them, ensuring the supply-to-price ratio remains accurate.
- Curve Variations: Models like Linear, Exponential, and Sigmoid allow developers to choose between steady growth, early incentive structures, or long-term price stabilization.
- Launchpad Standard: Platforms like Pump.fun have popularized bonding curves as the primary method for launching meme coins with fair distribution and zero pre-sales.
Bottom Line
In 2025, bonding curves remain the gold standard for decentralized price discovery, offering a mathematically pure solution to the liquidity problems that once plagued early crypto startups. By removing the middleman and replacing order books with code, they create a transparent and fair “buy-in” mechanism that rewards early conviction while guaranteeing a constant exit path. For investors and developers alike, mastering the math behind these curves is the key to identifying sustainable tokenomics in an increasingly automated financial landscape.