
The cryptocurrency market’s unique characteristics, such as its 24/7 nature and susceptibility to rapid shifts, make understanding technical analysis paramount. Unlike traditional markets, crypto often experiences heightened volatility, which can lead to significant gains or losses. By mastering the principles of technical analysis, traders can better anticipate these movements, manage risk, and identify potential trading opportunities with greater confidence.
While understanding Technical Analysis is important, applying that knowledge is where the real growth happens. Create Your Free Crypto Trading Account to practice with a free demo account and put your strategy to the test.
What is technical analysis in crypto?
Technical analysis in crypto is the study of historical price charts and trading volume to forecast future price movements of digital assets. It operates on the core belief that all available market information is already reflected in the asset’s price, and that prices move in trends which tend to repeat over time.
Defining Crypto Technical Analysis
Crypto technical analysis involves examining various chart patterns, trading indicators, and historical price data to make informed trading decisions. Traders use this method to identify entry and exit points, set stop-loss levels, and understand the overall market structure of cryptocurrencies like Bitcoin (BTC) and . The goal is to leverage past market behavior to anticipate future price action.
The Core Principles: How it Works
Technical analysis rests on three fundamental assumptions:
- The market discounts everything: All relevant information—economic, political, and psychological—is already priced into the asset.
- Prices move in market trends: Prices follow distinct directions (up, down, or sideways) rather than moving randomly.
- History tends to repeat itself: Human psychology drives recurring patterns in price movements that can be identified and traded.
What is the difference between technical and fundamental analysis in crypto?
While technical analysis focuses on “when” to trade by analyzing market data, fundamental analysis evaluates “what” to buy by examining a cryptocurrency’s intrinsic value. This includes its underlying technology, utility, team, and roadmap. For example, a fundamental analyst might buy Solana because of its transaction speed, while a technical analyst buys it because it just broke out of a bullish flag pattern on high volume.
Price Action, Volume, and Candlesticks
Successfully navigating crypto markets requires a solid grasp of foundational concepts like price action, volume, and candlestick charts. These elements provide the raw data necessary to interpret market sentiment.
How to identify market trends in crypto using TA?
To identify market trends, traders look for specific sequences in price movement. An uptrend is defined by a series of “higher highs” and “higher lows.” Conversely, a downtrend is marked by “lower highs” and “lower lows.” A ranging market occurs when the price bounces between a horizontal support and resistance zone without a clear direction.
The Power of Volume Analysis
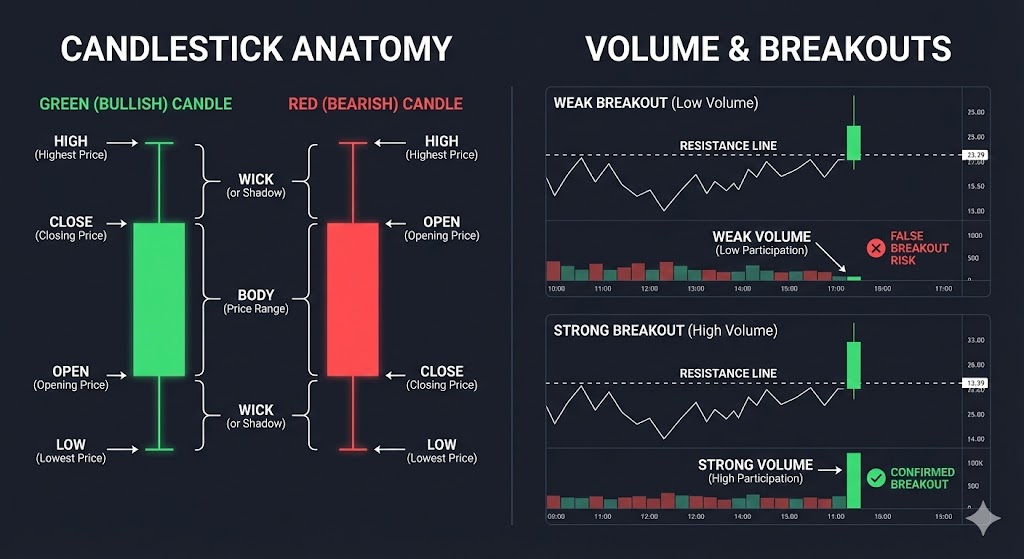
Volume represents the total number of units traded over a specific period. It acts as a “lie detector” for price action. A price breakout with high volume confirms strong market conviction. However, a price increase on low volume often suggests a lack of buying interest and a potential “fakeout.”
What crypto charts are essential for analysis?
Candlestick charts are the gold standard because they provide four data points (Open, High, Low, Close) in a single visual bar. Patterns such as the Doji (indicating indecision) or the Hammer (signaling a potential bullish reversal) offer immediate clues about who is winning the battle between buyers and sellers.
Identifying Key Support and Resistance Levels
Support levels are price floors where buying interest is strong enough to stop a decline. Resistance levels are price ceilings where selling pressure prevents the price from rising further. These levels are often psychological; for instance, Bitcoin often faces heavy resistance at “round numbers” like $100,000.
Ready to Elevate Your Trading?
You have the information. Now, get the platform. Join thousands of successful traders who use Volity for its powerful tools, fast execution, and dedicated support.
Create Your Account in Under 3 MinutesEssential Technical Indicators and Chart Patterns for Crypto Trading
Trading indicators and chart patterns are indispensable tools for crypto traders seeking to gain an edge. Indicators offer mathematical interpretations of data, while patterns reveal recurring human behavior.
What are the best technical indicators for crypto?
Popular indicators help filter noise and confirm trends:
- Relative Strength Index (RSI): Measures momentum. A reading above 70 is “overbought,” while below 30 is “oversold.”
- MACD (Moving Average Convergence Divergence): Shows the relationship between two moving averages to identify trend changes.
- Bollinger Bands: Measures volatility. When the bands “squeeze,” a major price move is usually imminent.
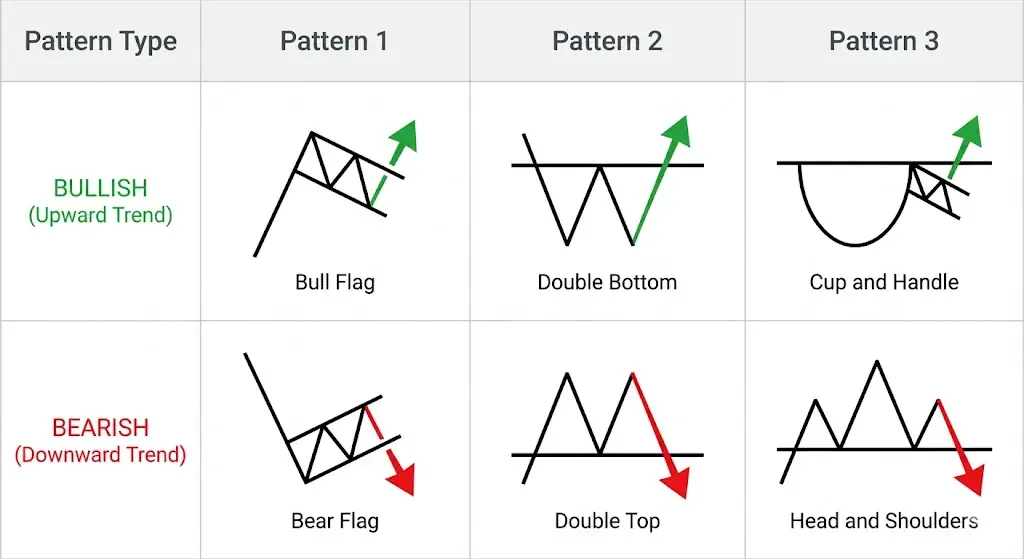
Recognizing Reversal and Continuation Chart Patterns
Reversal patterns like the Head and Shoulders or Double Top signal that a trend is ending. Continuation patterns like Bull Flags or Ascending Triangles suggest the trend is merely taking a breather before resuming. In 2025, Solana (SOL) famously displayed multiple bull flags during its ecosystem expansion, providing high-probability entry points for trend followers.
Mastering Risk Management in Volatile Crypto Markets
Risk management is the single most crucial aspect of trading. Without it, the most accurate analysis is useless. Since crypto can move 10% in minutes, your “exit strategy” must be decided before you ever enter a trade.
Key Components of a Solid Risk Management Plan
A professional plan focuses on position sizing. You should rarely risk more than 1–2% of your total capital on a single trade. This ensures that even a string of five losses won’t devastate your portfolio.
Risk/Reward Ratio Calculation
The risk/reward ratio measures your potential profit against your potential loss. A ratio of 1:2 means you are willing to lose $100 to make $200. Mathematically, if you maintain a 1:2 ratio, you only need to be right 34% of the time to break even.
The formula for the potential Return on Investment (ROI) is:
$$text{ROI} = left( frac{text{Current Value} – text{Initial Investment}}{text{Initial Investment}} right) times 100%$$
The Human Element: Overcoming Psychological Biases
Charts are objective, but humans are not. Fear of Missing Out (FOMO) drives traders to buy at the top of a rally, while Fear, Uncertainty, and Doubt (FUD) causes them to sell at the bottom. Mastering your “trading psychology” involves sticking to your plan even when your emotions are screaming at you to do otherwise.
Turn Knowledge into Profit
You've done the reading, now it's time to act. The best way to learn is by doing. Open a free, no-risk demo account and practice your strategy with virtual funds today.
Open a Free Demo AccountCombining Technical Analysis with On-Chain Data
In 2025, pure technical analysis is often supplemented with on-chain analysis. By looking at blockchain data, you can see if “whales” (large holders) are moving their coins onto exchanges to sell (bearish) or into cold storage to hold (bullish). Combining a bullish chart pattern with on-chain “accumulation” data provides a much higher level of conviction.
BOTTOM LINE
Technical analysis is not a crystal ball, but a statistical map for navigating the chaos of the crypto market. Success in 2025 belongs to the “hybrid trader”—one who respects the historical patterns of price action but verifies them through the lens of on-chain transparency and disciplined risk management. By stripping away the noise of social media hype and focusing on the mathematical reality of the charts, you transform trading from a game of chance into a professional pursuit of calculated edges. Your greatest asset isn’t a secret indicator; it’s the discipline to follow your system when the market is most volatile.
Key Takeaways
- Charts Reflect Psychology: Technical analysis works because it visualizes the recurring patterns of human greed and fear.
- Volume is Confirmation: A price move without significant trading volume is often a false signal; always look for volume to validate a breakout.
- Risk First, Profit Second: Successful traders focus on how much they can lose before they ever calculate how much they can win.
- Hybrid Approach: In 2025, the most effective strategy combines chart patterns with on-chain data (like exchange inflows) for deeper market insight.
- Trend is Your Friend: Trading against the prevailing market direction is the fastest way to lose capital; always identify the primary trend before looking for entries.