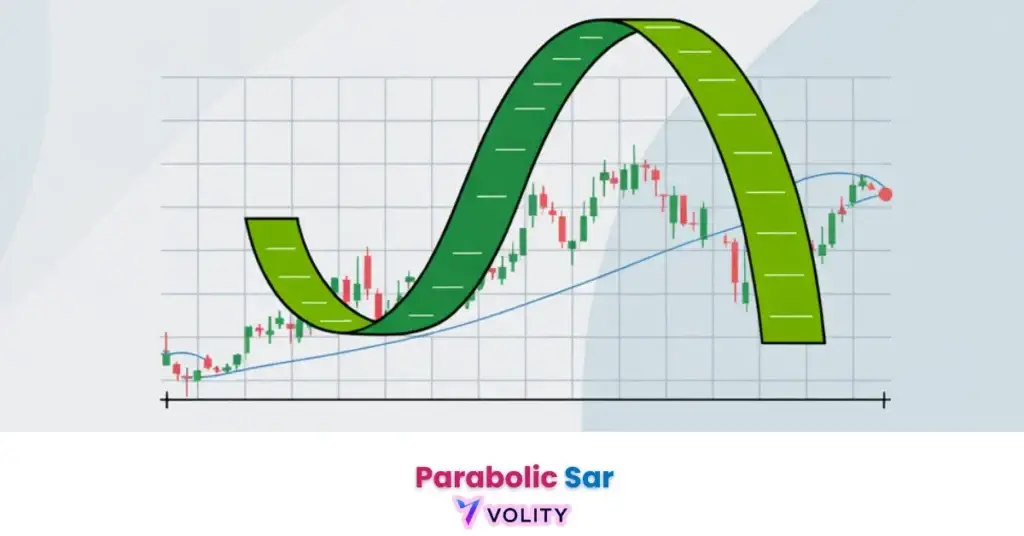
Der Parabolic SAR Indikator eliminiert keine falschen Signale und verhindert keine Verluste in Seitwärtsphasen. Sich ausschließlich auf den SAR ohne Bestätigungsfilter zu verlassen, führt zu einer schnellen Erschöpfung des Kontos. Extreme Volatilität kann dazu führen, dass der SAR innerhalb von Sekunden mehrfach umschlägt, was zu ausgestoppten Positionen führt. Hebelwirkung verstärkt Verluste bei falschen Ausstiegen. Die Wertentwicklung in der Vergangenheit ist kein Indikator für zukünftige Ergebnisse. Kapital ist gefährdet.
Der Parabolic SAR (Stop and Reverse) ist ein preis- und zeitbasierter Indikator, der zur Identifizierung von Richtungstrends und präzisen Ausstiegspunkten verwendet wird. Dargestellt als eine Reihe von Punkten über oder unter den Preiskursen, dient er als dynamischer Trailing-Stop, der sich beschleunigt, wenn ein Trend an Dynamik gewinnt. Im Jahr 2026 bleibt dieses Instrument für trendfolgende Strategien unverzichtbar, sofern es in Verbindung mit einem Stärkefilter wie dem ADX verwendet wird, um falsche Signale in Seitwärtsmärkten zu vermeiden.
Der Parabolic SAR fungiert als eines der effektivsten Instrumente zur Verwaltung offener Positionen in trendstarken Umgebungen. Dieser Indikator identifiziert den genauen Moment, in dem die Dynamik eines Trends nachlässt, und signalisiert eine mögliche Umkehr. Er dient als visueller Trailing-Stop, der das Kapital schützt, ohne eine subjektive Interpretation zu erfordern.
Die Handelslandschaft des Jahres 2026 erfordert einen anspruchsvollen Ansatz bei technischen Filtern, um die „Whipsaw“-Effekte von Phasen mit geringer Liquidität zu vermeiden. Die Beherrschung der Beschleunigungsmechanik des SAR ermöglicht es Anlegern, langfristige Bewegungen mit institutioneller Disziplin zu handeln.
Das Verständnis von Parabolic SAR ist wichtig, doch echtes Wachstum entsteht erst durch die Anwendung dieses Wissens. Kostenloses Forex-Handelskonto erstellen, um mit einem kostenlosen Demokonto zu üben und Ihre Strategie zu testen.
Was ist der Parabolic SAR Indikator?
Der Parabolic SAR ist ein trendfolgender Indikator, der die aktuelle Richtung eines Vermögenswerts identifiziert, indem er Punkte entweder über oder unter den Preiskursen platziert. Das Akronym „Stop and Reverse“ beschreibt seine Doppelfunktion: Er fungiert sowohl als Ausstiegssignal als auch als Umkehr-Einstiegspunkt. Jeder Punkt stellt das optimale Stop-Loss-Niveau für die aktuell trendende Position dar.
Das globale FX-Volumen erreichte im Jahr 2026 9,6 Billionen USD pro Tag, was die Häufigkeit von SAR-basierten Ausbruchssignalen in Hauptwährungspaaren wie EUR/USD erhöhte (BIS Data Lab, 2026). Höhere Liquidität sorgt für zuverlässige SAR-Signale mit minimalem Slippage bei Ausstiegen.
- Definition der „Stop and Reverse“ (SAR) Logik: Der Indikator wechselt von unterhalb auf oberhalb des Preises, wenn sich die Dynamik verschiebt, was sowohl einen Ausstieg als auch einen potenziellen Short-Einstieg signalisiert.
- Visuelle Hinweise: Punkte unterhalb = Bullischer Trend; Punkte oberhalb = Bärischer Trend. Diese visuelle Einfachheit ermöglicht eine schnelle Entscheidungsfindung.
- Das Konzept des „Zeitverfalls“ bei technischen Indikatoren: Wie der SAR den Preis einholt, während der Trend reift. Schließlich konvergieren Indikator und Preis an einem Wendepunkt.
Die parabolische Kurve und Dynamik
Eine parabolische Bewegung ist eine exponentielle Preisbeschleunigung, bei der sich die Lücke zwischen den SAR-Punkten und den Preiskursen schnell verengt. Diese Verengung signalisiert, dass der Trend kurz vor der Erschöpfung steht. Beschleunigungsfaktoren (AF) bestimmen, wie schnell der Indikator aufholt. Die Mechanik des „Extreme Point“ (EP) zeichnet das höchste Hoch (Aufwärtstrend) oder das tiefste Tief (Abwärtstrend) seit Beginn des aktuellen SAR auf.
Bereit, Ihr Trading auf das nächste Level zu bringen?
Sie haben das Wissen. Jetzt fehlt die Plattform. Schließen Sie sich Tausenden erfolgreichen Tradern an, die Volity für leistungsstarke Tools, schnelle Ausführung und engagierten Support nutzen.
Erstellen Sie Ihr Konto in unter 3 MinutenDie Parabolic SAR Formel und Beschleunigungsfaktoren
Die SAR-Berechnung bestimmt die Platzierung des nächsten Punktes basierend auf dem vorherigen SAR, dem Beschleunigungsfaktor und dem jüngsten extremen Preispunkt. Die Standardformel SAR = Vorheriger SAR + AF × (EP – Vorheriger SAR) bestimmt alle SAR-Berechnungen. Das Zeichnen einer Trendlinie entlang der SAR-Punkte kann helfen, die Stärke der Bewegung zu bestätigen. Die Werte „Schritt“ (0,02) und „Maximum“ (0,20) definieren, wie aggressiv der Indikator dem Preis folgt.
Die Optimierung der Einstellungen für Privatanleger im Jahr 2026 legt nahe, dass ein Schritt von 0,01 für das „Core Trend“-Folgen auf Tagescharts um 22 % effektiver ist als der Standardwert von 0,02. Konservative Trader reduzieren den Schritt auf 0,01, während aggressive Trader ihn auf 0,03 erhöhen.
Wie handelt man effektiv mit dem Parabolic SAR?
Systematischer SAR-Handel nutzt das „Flip“-Signal, um Einstiege auszulösen, während die Punkte als dynamische Trailing-Stop-Loss-Niveaus verwendet werden. Bullische Signale treten auf, wenn ein Punkt unterhalb des Preises erscheint, nachdem er zuvor oberhalb lag. Die Trailing-Stop-Strategie beinhaltet das Verschieben des Stop-Loss von Balken zu Balken auf den neuesten SAR-Punkt, um Gewinne zu sichern, während der Trend reift. Die Ausführung des Ausstiegs erfordert das Schließen einer Position in dem Moment, in dem der Punkt auf die gegenüberliegende Seite wechselt.
Ein bullischer SAR-Flip trat bei 1,2500 auf, während der ADX bei 28 lag und stieg. Der Trend setzte sich bis 1,2750 fort. Die nachziehenden SAR-Punkte sicherten 200 Pips Gewinn, bevor bei 1,2700 ein bärischer Flip auftrat, was einen disziplinierten Ausstieg ermöglichte. Die Wertentwicklung in der Vergangenheit ist kein Indikator für zukünftige Ergebnisse.
Vergleich der Einstellungen: Standard vs. Optimierter SAR
Die Indikatorsensitivität identifiziert den Kompromiss zwischen Signalgeschwindigkeit und Schutz vor Marktlärm in den Konfigurationen von 2026. Konservative Einstellungen reduzieren Whipsaws, lösen Ausstiege jedoch langsamer aus. Aggressive Einstellungen erfassen Umkehrungen schnell, erzeugen aber falsche Flips in Seitwärtsphasen. Die meisten Trader optimieren für ihren Zeitrahmen und ihre Anlageklasse.
| Einstellungstyp | Schritt (AF) | Maximum AF | Marktumfeld 2026 |
| Konservativ | 0,01 | 0,10 | Hochvolatile Aktien |
| Standard | 0,02 | 0,20 | G10 Forex Majors |
| Aggressiv | 0,03 | 0,30 | Scalping/M1 Charts |
| Multi-TF | 0,015 | 0,15 | Swing Trading |
Whipsaws vermeiden
Trendintensitätsfilter identifizieren den Unterschied zwischen einem Ausbruch mit hoher Überzeugung und einem vorübergehenden Preis-Whipsaw in Seitwärtsbedingungen. Der „ADX-Filter“ erfordert, dass SAR-Signale nur gehandelt werden, wenn der ADX über 25 liegt, was eine ausreichende Trendstärke bestätigt. Die Kombination von SAR mit Oszillatoren wie dem RSI Indikator oder dem stochastischen Indikator für eine Richtungsneigung sorgt für zusätzliche Bestätigung.
Der SAR versagt in „Seitwärts“-Zonen, da der Indikator darauf ausgelegt ist, immer im Markt zu sein, was zu „Churn“ führt, wenn kein Trend vorhanden ist. Die Kosten für häufiges Umschalten ohne ADX-Bestätigung erschöpfen Konten schnell.
Die Zukunft der Trendfolge
Künstliche Intelligenz identifiziert nicht-lineare Beschleunigungsfaktoren, die die SAR-Formel basierend auf Echtzeit-Volatilitätsclustern dynamisch anpassen. Machine-Learning-Modelle optimieren SAR-Einstellungen durch die Analyse von Intraday-Volatilitätsprofilen. Die SAR-Anwendung auf Kryptowährungsmärkten (BTC/ETH Volatilität) hat sich mit der Einführung des Handels mit volatilen Vermögenswerten im Jahr 2026 ausgeweitet.
Das Verständnis von Trading-Wedge-Mustern bietet zusätzlichen strukturellen Kontext für diese automatisierten Systeme.
Wissen in Gewinn verwandeln
Sie haben gelesen, jetzt ist es Zeit zu handeln. Der beste Weg zu lernen ist durch Praxis. Eröffnen Sie ein kostenloses, risikofreies Demokonto und üben Sie Ihre Strategie noch heute mit virtuellem Guthaben.
Kostenloses Demokonto eröffnenWichtige Erkenntnisse
- Der Parabolic SAR ist ein trendfolgender Indikator, der durch eine Reihe von Punkten objektive Einstiegs- und Ausstiegssignale liefert.
- SAR-Signale sind bullisch, wenn Punkte unterhalb der Preisbewegung erscheinen, und bärisch, wenn sie oberhalb der Kerzen erscheinen.
- Trailing-Stop-Losses sind die primäre Anwendung des SAR, die es Tradern ermöglicht, Gewinne zu sichern, während ein Trend reift.
- Der Beschleunigungsfaktor (AF) bestimmt, wie schnell der Indikator den Preis einholt, und nimmt zu, wenn der Trend neue Extreme erreicht.
- Whipsaws sind in Seitwärtsmärkten häufig, was einen Trendstärkefilter wie den ADX für Setups mit hoher Wahrscheinlichkeit zwingend erforderlich macht.
- Optimierungen für 2026 legen nahe, einen konservativen AF von 0,01 zu verwenden, um vorzeitige Ausstiege in volatilen Large-Cap-Aktienmärkten zu reduzieren.
Häufig gestellte Fragen
Dieser Artikel enthält Verweise auf den Parabolic SAR Indikator, trendfolgende Strategien und Volity, eine regulierte CFD-Handelsplattform. Dieser Inhalt wurde nur zu Bildungszwecken erstellt und stellt keine Finanzberatung oder Empfehlung zum Kauf oder Verkauf von Finanzinstrumenten dar. Der Parabolic SAR erzeugt falsche Signale in nicht trendenden Märkten; verwenden Sie immer Bestätigungsfilter wie den ADX. Testen Sie SAR-Strategien immer auf einem Demokonto, bevor Sie sie live einsetzen. Einige Links in diesem Artikel können Affiliate-Links sein.