Breakout-Trading beinhaltet die Ausführung von Positionen an Preisniveaus, an denen Hochfrequenz-Algorithmen den Volumenfluss dominieren. Im Jahr 2026 stammen 85 % des Breakout-Volumens von automatisierten Systemen, was auf niedrigeren Zeitrahmen zu Fakeout-Raten von über 70 % führt. Forex- und CFD-Breakout-Trading birgt extreme Hebelrisiken, bei denen Margin Calls und Kapitalverluste innerhalb von Minuten möglich sind. Überprüfen Sie immer die Volumenbestätigung und platzieren Sie Stop-Loss-Orders außerhalb der Liquiditätszonen. Die Wertentwicklung in der Vergangenheit ist kein Indikator für zukünftige Ergebnisse. Kapital ist gefährdet.
Breakout-Trading umfasst die Ausführung von Trades, wenn der Preis etablierte Unterstützungs- oder Widerstandsniveaus durchbricht. Im Jahr 2026 treiben Hochfrequenz-Algorithmen 85 % des Breakout-Volumens an, was von Tradern eine Volumenbestätigung von 150 % erfordert. Dieser Leitfaden optimiert Ihre Ausführungsstrategie durch die Identifizierung von Mustern mit hoher Wahrscheinlichkeit und das Management des 70 % Fakeout-Risikos.
Das Verständnis von Breakout Trading ist wichtig, doch echtes Wachstum entsteht erst durch die Anwendung dieses Wissens. Kostenloses Forex-Handelskonto erstellen, um mit einem kostenlosen Demokonto zu üben und Ihre Strategie zu testen.
Breakout-Trading ist eine auf Momentum basierende Strategie, die es Tradern ermöglicht, Positionen zu Beginn neuer Markttrends einzugehen. Auf dem Markt von 2026 führt algorithmischer Handel den Großteil des Breakout-Volumens aus, was sowohl Chancen als auch ein erhöhtes Fakeout-Risiko schafft. Zu verstehen, wie man Bewegungen mit hoher Wahrscheinlichkeit von algorithmischen Liquiditäts-Sweeps filtert, definiert den Vorteil bei dieser Strategie.
Der Breakout-Ansatz erfasst die „Animal Spirits“-Rotationen, die auftreten, wenn sich die Marktstimmung in Richtung spezifischer Sektoren wie Edge AI verschiebt. Diese Bewegungen frühzeitig zu erfassen, bietet eine bessere Einstiegseffizienz als Trendfolge-Ansätze, die erst bestätigen, nachdem sich der Preis bereits signifikant bewegt hat. Der Kompromiss besteht darin, ein höheres Fakeout-Risiko auf niedrigeren Zeitrahmen zu managen, wo Interaktionen zwischen Algorithmen Rauschen erzeugen.
Warum ist Breakout-Trading im Jahr 2026 entscheidend?
Breakout-Trading ist eine auf Momentum basierende Strategie, die es Tradern ermöglicht, Positionen zu Beginn neuer Markttrends einzugehen. Die algorithmische Preisbewegung im Jahr 2026 bedeutet, dass 85 % des Handelsvolumens an Breakout-Niveaus von Hochfrequenzsystemen stammen. Diese Verschiebung schafft ein Umfeld, in dem die traditionelle Analyse von Unterstützung und Widerstand einen algorithmischen Kontext erfordert, um Fakeouts zu vermeiden.
„Animal Spirits“-Rotationen, plötzliche institutionelle Kapitalflüsse in Sektoren mit hoher Überzeugung, erzeugen die profitabelsten Breakout-Gelegenheiten. Die Sektoren Edge AI, Critical Minerals und Advanced Logistics zeigen während Breakout-Ereignissen eine konsistente Volatilitätsausweitung von über 40 %. Diese sektoralen Rotationen treiben makroökonomische Themen an, die Breakout-Bewegungen über den anfänglichen institutionellen Einstieg hinaus aufrechterhalten.
Die Ausführungsgeschwindigkeit zu Beginn eines Breakouts verbessert die Effizienz des Einstiegspreises im Vergleich zu Trendfolge-Indikatoren. Ein Trader, der bei einem bestätigten Volumensprung von 150 % einsteigt, erfasst das anfängliche Momentum des Trends. Im Gegensatz dazu steigt ein Trendfolger, der auf eine Preisbestätigung wartet, im Durchschnitt 3-5 % höher ein, was das Chance-Risiko-Verhältnis verringert.
Wie identifizieren Sie Breakouts mit hoher Wahrscheinlichkeit?
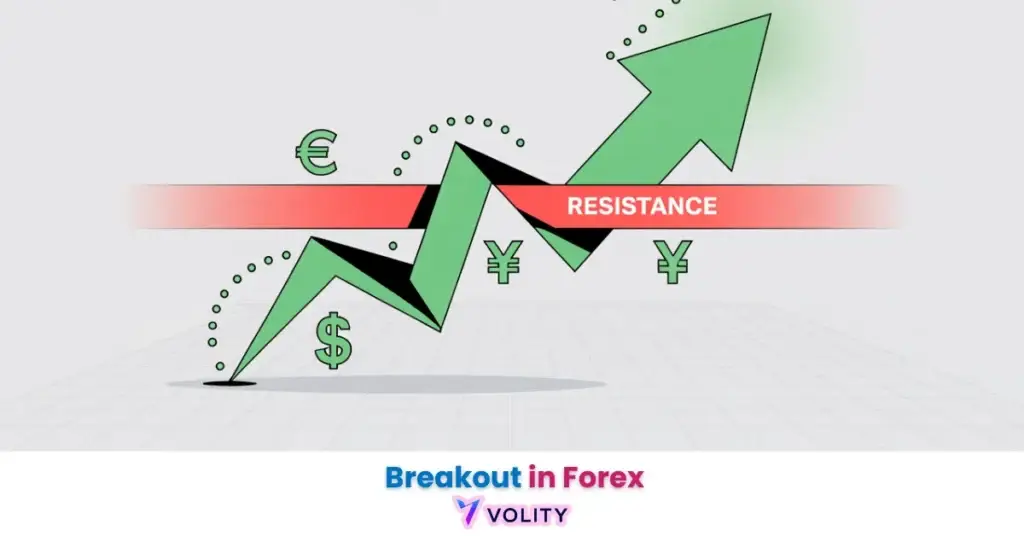
Breakouts sind nur dann relevant, wenn sie klare Unterstützungs- und Widerstandsniveaus durchbrechen; bestätigen Sie dies mit RSI-Divergenz und einer korrekten Trendlinien-Validierung.
Breakouts mit hoher Wahrscheinlichkeit sind Preisbewegungen, die durch einen Anstieg des Handelsvolumens um 150 % im Verhältnis zum 20-Tage-Durchschnitt bestätigt werden. Die 150 %-Volumenregel fungiert als primärer Filter, der algorithmisch gesteuerte institutionelle Bewegungen von Liquiditäts-Sweeps im Retail-Bereich trennt. Dieser Schwellenwert identifiziert, dass ausreichend institutionelles Kapital in die Breakout-Richtung investiert wurde.
Die Volumenprofil-Analyse zeigt „Value Area“-Ausbrüche, also den Preisbereich, in dem sich der Großteil des jüngsten Volumens konzentriert hat. Breakouts, die über die Value Area hinaus mit steigendem Volumen erfolgen, zeigen eine höhere Wahrscheinlichkeit für eine Fortsetzung. Umgekehrt deuten Breakouts, die innerhalb der Value Area bei sinkendem Volumen auftreten, auf algorithmisch gesteuerte Liquiditätssuche ohne institutionelle Nachfolge hin.
Die Wahl des Zeitrahmens beeinflusst das Fakeout-Risiko dramatisch. Der 1-Minuten-Chart zeigt eine Fakeout-Rate von 70 %, was Einstiege ohne zusätzliche Bestätigung unzuverlässig macht. Die Zeitrahmen von 15 Minuten bis 4 Stunden reduzieren die Fakeout-Raten auf 15-25 %, wenn sie mit dem 150 %-Volumenfilter kombiniert werden. Tägliche und wöchentliche Zeitrahmen reduzieren das Rauschen weiter, opfern jedoch den Vorteil des frühen Einstiegs. Volumendivergenz-Muster zeigen, wann das Volumenmomentum vom Preismomentum abweicht, was auf eine Breakout-Schwäche hindeutet.
Wie handelt man Breakout-Muster und Retests?
Das Break-and-Retest-Modell ist eine Strategie zur Risikominderung, bei der Trader Einstiege erst dann ausführen, wenn der Preis ein durchbrochenes Niveau als neue Unterstützung oder neuen Widerstand validiert. Dieser konservative Ansatz erhöht die Gewinnrate von 55 % (sofortiger Breakout-Einstieg) auf 68 % (Retest-Einstieg), opfert jedoch die Erfassung des anfänglichen Breakout-Momentums.
Handelskanäle, Dreiecke und Keile bieten den geometrischen Rahmen für die Identifizierung von Breakout-fähigen Mustern. Symmetrische Dreiecke kollabieren in 60 % der Fälle innerhalb der rechten Begrenzung des Musters in einen Breakout. Absteigende Dreiecke tendieren zu Abwärtsausbrüchen; aufsteigende Dreiecke tendieren zu Aufwärtsausbrüchen. Kanäle erzeugen Breakouts, wenn der Preis entweder den oberen Widerstand oder die untere Unterstützungslinie durchbricht.
Das Management von OCO-Orders (One-Cancels-the-Other) bei symmetrischen Setups schützt vor einer zweideutigen Breakout-Richtung. Das Setzen eines Buy-Stops über der oberen Grenze des Kanals und eines Sell-Stops unter der unteren Grenze führt nur den Breakout aus, der zuerst auftritt. VWAP-Rückeroberungssignale bieten zusätzliche Bestätigung; wenn der Preis nach einem Breakout über dem VWAP schließt, findet eine institutionelle Akkumulation statt.
Reales Handelsbeispiel:
Die Ausführung eines Buy-Stops bei 1,0850 auf EUR/USD nach Identifizierung eines 150 %-Volumensprungs über dem täglichen Widerstand löste den Einstieg bei Eröffnung der Londoner Sitzung aus. Der Breakout erfasste 50 Pips an direktionalem Momentum, bevor er sich auf einem neuen Unterstützungsniveau konsolidierte. Die Wertentwicklung in der Vergangenheit ist kein Indikator für zukünftige Ergebnisse.
Was sind die wichtigsten Breakout-Trading-Kennzahlen für 2026?
Breakout-Trading-Kennzahlen im Jahr 2026 zeigen, dass Ausführungsgeschwindigkeit und Sektorauswahl die primären Treiber der Profitabilität sind. Die folgenden Daten quantifizieren das operative Umfeld für Breakout-Trader.
| Breakout-Kennzahl | Kategorie | Wert |
| Breakout | 1m Fakeout-Rate | 70 % |
| Breakout | Vol.-Schwellenwert | 150 % |
| Breakout | HFT-Einfluss | 85 % |
| Breakout | Sektorerfolg | 42 % (Edge AI) |
| Breakout | Ausführungsvorteil | 12 % (Fiber VPS) |
Quellen: AlphaMind, BIS, Bloomberg (2026).
Wie managt man Risiken und vermeidet falsche Breakouts?
Risikomanagement beim Breakout-Trading ist der systematische Prozess, Stop-Loss-Orders außerhalb der Zonen der „Liquiditätssuche“ zu setzen, um Kapital zu schützen. Liquiditätssuchzonen treten 1-3 % jenseits von Unterstützungs- oder Widerstandslinien auf, wo Algorithmen Stop-Orders auslösen, bevor sie umkehren. Das Platzieren Ihres Stops 4-5 % jenseits des Breakout-Niveaus vermeidet diese vorhersehbaren Liquidationspunkte.
Die ATR (Average True Range) Volatilität bietet einen mathematischen Ansatz für die Stop-Platzierung. Die Verwendung der 2-Perioden-ATR als Stop-Abstand berücksichtigt die tatsächliche Marktvolatilität anstelle willkürlicher Prozentniveaus. Bei einem Breakout mit einer 120-Punkt-ATR bietet das Platzieren eines 240-Punkt-Stops (2 ATR) einen angemessenen Puffer gegen algorithmisch gesteuerte Umkehrungen.
Die „Mittagspause“ (11:30, 14:00 Uhr ET) zeigt 35 % höhere Fakeout-Raten als andere Sitzungen aufgrund der reduzierten institutionellen Beteiligung. Das Vermeiden von Breakout-Trades während dieses Zeitfensters verbessert die Gesamtgewinnraten, indem die qualitativ minderwertigsten Breakout-Signale gefiltert werden. Psychologische Kontrolle verhindert Verstöße gegen den Leitfaden für intelligentes Risikomanagement; Rache-Trading nach Fakeouts führt bei gehebelten Positionen schnell zu hohen Verlusten.
Wissen in Gewinn verwandeln
Sie haben gelesen, jetzt ist es Zeit zu handeln. Der beste Weg zu lernen ist durch Praxis. Eröffnen Sie ein kostenloses, risikofreies Demokonto und üben Sie Ihre Strategie noch heute mit virtuellem Guthaben.
Kostenloses Demokonto eröffnenWichtige Erkenntnisse
- Breakout-Trading führt Positionen zu Beginn neuer Preistrends aus und erfasst Momentum vor bestätigungsbasierten Followern.
- Der 150 %-Volumenschwellenwert identifiziert institutionelle Breakouts und trennt sie von 70 % Fakeout-Rauschen auf 1-Minuten-Charts.
- Hochfrequenz-Algorithmen treiben 85 % des Breakout-Volumens an, was von Tradern erfordert, algorithmische Liquiditäts-Sweeps und Stop-Hunts zu berücksichtigen.
- Das Break-and-Retest-Modell erhöht die Gewinnrate auf 68 %, indem gewartet wird, bis der Preis ein durchbrochenes Niveau als neue Unterstützung oder neuen Widerstand validiert.
- ATR-basierte Stop-Loss-Platzierung schützt vor algorithmisch gesteuerten Umkehrungen, indem Stops außerhalb vorhersehbarer Liquiditätssuchzonen positioniert werden.
- Tägliche und wöchentliche Zeitrahmen reduzieren das Fakeout-Risiko auf 15-25 %, wenn sie mit Volumenbestätigung kombiniert werden, und handeln langsamere Trends mit höherer Zuverlässigkeit.
Häufig gestellte Fragen
Dieser Artikel enthält Verweise auf Breakout-Trading und Volity, eine regulierte CFD-Handelsplattform. Dieser Inhalt wurde nur zu Bildungszwecken erstellt und stellt keine Finanzberatung oder Empfehlung zum Kauf oder Verkauf eines Finanzinstruments dar. Überprüfen Sie immer den aktuellen regulatorischen Status und die Plattformdetails, bevor Sie einen Handelsdienst nutzen. Einige Links in diesem Artikel können Affiliate-Links sein.
Was unsere Analysten beobachten: Drei Filter trennen einen handelbaren Breakout von einem Stop-Hunt-Liquiditäts-Sweep. Volumen auf der Breakout-Kerze (ein echter Ausbruch druckt ein Volumen von mindestens dem 1,5-fachen des 20-Bar-Durchschnitts; Ausbrüche bei sinkendem Volumen kehren in etwa zwei Dritteln der Fälle um). Ausrichtung auf höheren Zeitrahmen (ein Vier-Stunden-Breakout, der ein Niveau auf dem Tages-Chart durchbricht, hat materiell höhere Folgebewegungen als ein Vier-Stunden-Breakout inmitten einer Tages-Range). Stop-Platzierung außerhalb offensichtlicher Liquidität (der Lehrbuch-Stop knapp unter einem durchbrochenen Widerstand ist derselbe Stop, den die Algorithmen jagen; den Stop eine volle ATR hinter die Linie zu platzieren und dabei die größere Positionsgrößen-Strafe in Kauf zu nehmen, verbessert die Gewinnrate materiell, indem der einfache Sweep entfernt wird). Wenn alle drei übereinstimmen, ist der Breakout investierbar; wenn einer davon nachlässt, bleibt der Trader passiv und wartet ab.
Volity betreibt eine Handelsplattform und veröffentlicht außerdem Bildungs- und Analyseinhalte zum Thema Trading. Die Inhalte dieser Seite dienen ausschließlich Bildungszwecken und sind nicht als Finanzberatung zu verstehen. Volity kann kommerziell profitieren, wenn Leser über Links auf dieser Website Handelskonten eröffnen.
Unsere Inhalte werden nach dokumentierten redaktionellen Standards erstellt und geprüft; siehe unsere Vergleichs- und Bewertungsmethodik.