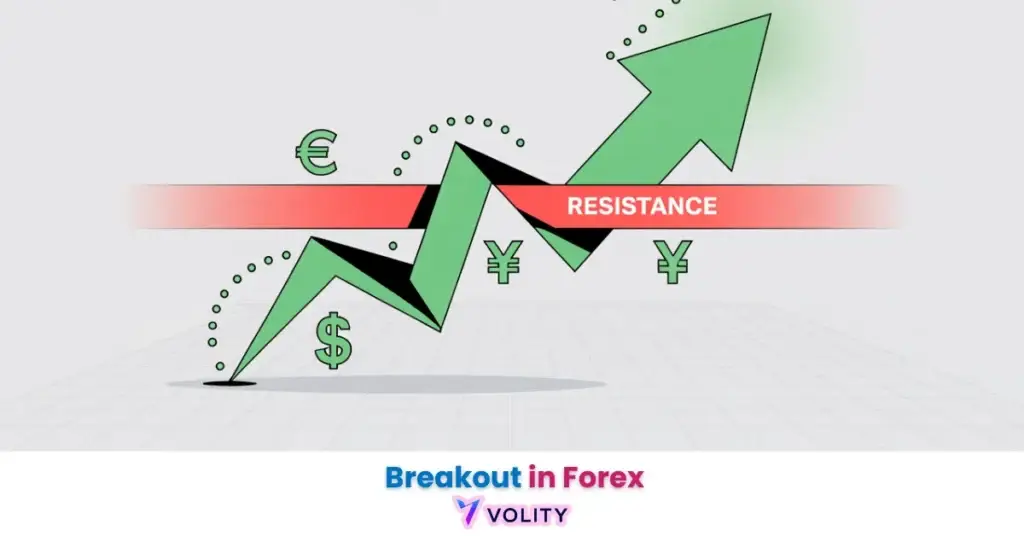
Le trading de cassure (breakout) implique l’exécution de positions à des niveaux de prix où les algorithmes à haute fréquence dominent le flux de volume. En 2026, 85 % du volume de cassure provient de systèmes automatisés, créant des taux de fausse cassure (fakeout) dépassant 70 % sur les unités de temps inférieures. Le trading de cassure sur le Forex et les CFD comporte un risque de levier extrême, avec des appels de marge et une liquidation du capital possibles en quelques minutes. Vérifiez toujours la confirmation par le volume et maintenez vos stops en dehors des zones de liquidité. Les performances passées ne préjugent pas des résultats futurs. Capital à risque.
Le trading de cassure consiste à exécuter des transactions lorsque le prix dépasse des niveaux de support ou de résistance établis. En 2026, les algorithmes à haute fréquence génèrent 85 % du volume de cassure, obligeant les traders à confirmer les mouvements avec un seuil de volume de 150 %. Ce guide optimise votre stratégie d’exécution en identifiant les configurations à haute probabilité et en gérant le risque de 70 % de fausse cassure.
Comprendre Breakout Trading est important, mais la vraie progression commence en appliquant ces connaissances. Créez votre compte de trading forex gratuit pour vous entraîner sur un compte démo gratuit et mettre votre stratégie à l’épreuve.
Le trading de cassure est une stratégie basée sur le momentum qui permet aux traders d’exécuter des positions au début de nouvelles tendances de marché. Sur le marché de 2026, le trading algorithmique exécute la majorité du volume de cassure, créant à la fois des opportunités et un risque accru de fausse cassure. Comprendre comment filtrer les mouvements à haute probabilité des balayages de liquidité algorithmiques définit l’avantage dans cette stratégie.
L’approche de cassure capture les rotations des « Animal Spirits » qui se produisent lorsque le sentiment du marché s’oriente vers des secteurs spécifiques comme l’Edge AI. Capturer ces mouvements tôt offre une meilleure efficacité d’entrée que les approches de suivi de tendance qui ne confirment qu’après que le prix a considérablement bougé. Le compromis implique la gestion d’un risque de fausse cassure plus élevé sur les unités de temps inférieures, où les interactions algorithme-à-algorithme créent du bruit.
Pourquoi le trading de cassure est-il critique en 2026 ?
Le trading de cassure est une stratégie basée sur le momentum qui permet aux traders d’exécuter des positions au début de nouvelles tendances de marché. L’action des prix algorithmique en 2026 signifie que 85 % du volume de trading aux niveaux de cassure provient de systèmes à haute fréquence. Ce changement crée un environnement où l’analyse traditionnelle support-résistance nécessite un contexte algorithmique pour éviter de subir des fausses cassures.
Les rotations des « Animal Spirits », flux soudains de capitaux institutionnels vers des secteurs à forte conviction, génèrent les opportunités de cassure les plus rentables. Les secteurs de l’Edge AI, des minéraux critiques et de la logistique avancée affichent une expansion de la volatilité constante de 40 % et plus lors des événements de cassure. Ces rotations sectorielles alimentent des thèmes macroéconomiques qui soutiennent les mouvements de cassure au-delà de l’entrée institutionnelle initiale.
La vitesse d’exécution au début de la cassure améliore l’efficacité du prix d’entrée par rapport aux indicateurs de suivi de tendance. Un trader entrant sur le pic de volume confirmé de 150 % capture le momentum initial de la tendance. À l’inverse, un suiveur de tendance attendant la confirmation du prix entre en moyenne 3 à 5 % plus haut, réduisant le ratio risque-récompense.
Comment identifier les cassures à haute probabilité ?
Les cassures ne comptent que lorsqu’elles franchissent des niveaux de support et de résistance nets ; confirmez avec la divergence du RSI et une validation appropriée de la ligne de tendance.
Les cassures à haute probabilité sont des mouvements de prix confirmés par une augmentation de 150 % du volume de trading par rapport à la moyenne sur 20 jours. La règle du volume de 150 % fonctionne comme le filtre principal séparant les mouvements institutionnels pilotés par algorithmes des balayages de liquidité de détail. Ce seuil identifie qu’un capital institutionnel suffisant s’est engagé dans la direction de la cassure.
L’analyse du profil de volume révèle les sorties de la « Value Area », la plage de prix où la majorité du volume récent s’est concentrée. Les cassures qui se situent au-dessus de la Value Area avec un volume en expansion montrent une probabilité de continuation plus élevée. À l’inverse, les cassures qui se produisent à l’intérieur de la Value Area sur un volume en baisse suggèrent une chasse à la liquidité pilotée par algorithmes sans suivi institutionnel.
La sélection de l’unité de temps impacte considérablement l’exposition aux fausses cassures. Le graphique en 1 minute affiche un taux de fausse cassure de 70 %, rendant les entrées peu fiables sans confirmation supplémentaire. Les unités de temps de 15 minutes à 4 heures réduisent les taux de fausse cassure à 15-25 % lorsqu’elles sont combinées avec le filtre de volume de 150 %. Les unités de temps journalières et hebdomadaires réduisent davantage le bruit mais sacrifient l’avantage de l’entrée précoce. Les modèles de divergence de volume révèlent quand le momentum du volume diverge du momentum du prix, signalant une faiblesse de la cassure.
Comment trader les modèles de cassure et les retests ?
Le modèle de cassure et retest est une stratégie d’atténuation des risques où les traders exécutent des entrées uniquement après que le prix valide un niveau cassé comme nouveau support ou résistance. Cette approche conservatrice augmente le taux de réussite de 55 % (entrée immédiate sur cassure) à 68 % (entrée sur retest), bien qu’elle sacrifie la capture du momentum de cassure initial.
Le trading des canaux, triangles et biseaux fournit le cadre géométrique pour identifier les modèles éligibles à une cassure. Les triangles symétriques s’effondrent en une cassure dans 60 % des cas à l’intérieur de la limite du bord droit du modèle. Les triangles descendants biaisent les cassures vers le bas ; les triangles ascendants biaisent les cassures vers le haut. Les canaux génèrent des cassures lorsque le prix franchit soit la résistance supérieure, soit la ligne de support inférieure.
La gestion des ordres OCO (One-Cancels-the-Other) sur les configurations symétriques protège contre une direction de cassure ambiguë. Placer un buy-stop au-dessus de la borne supérieure du canal et un sell-stop en dessous de la borne inférieure exécute uniquement la cassure qui se produit en premier. Les signaux de récupération du VWAP (Volume-Weighted Average Price) offrent une confirmation supplémentaire ; lorsque le prix clôture au-dessus du VWAP après une cassure, une accumulation institutionnelle est en cours.
Exemple de trading réel :
L’exécution d’un buy-stop à 1,0850 sur l’EUR/USD après avoir identifié un pic de volume de 150 % au-dessus de la résistance journalière a déclenché l’entrée à l’ouverture de la session de Londres. La cassure a capturé 50 pips de momentum directionnel avant de consolider à un nouveau niveau de support. Les performances passées ne préjugent pas des résultats futurs.
Quelles sont les métriques clés du trading de cassure pour 2026 ?
Les métriques du trading de cassure en 2026 révèlent que la vitesse d’exécution et la sélection sectorielle sont les principaux moteurs de la rentabilité. Les données suivantes quantifient l’environnement opérationnel pour les traders de cassure.
| Métrique de cassure | Catégorie | Valeur |
| Cassure | Taux de fausse cassure 1m | 70 % |
| Cassure | Seuil de volume | 150 % |
| Cassure | Influence HFT | 85 % |
| Cassure | Succès sectoriel | 42 % (Edge AI) |
| Cassure | Avantage exécution | 12 % (Fiber VPS) |
Sources : AlphaMind, BIS, Bloomberg (2026).
Comment gérer les risques et éviter les fausses cassures ?
La gestion des risques dans le trading de cassure est le processus systématique consistant à placer des stop-loss en dehors des zones de « chasse à la liquidité » pour protéger le capital. Les zones de chasse à la liquidité se produisent 1 à 3 % au-delà des lignes de support ou de résistance où les algorithmes déclenchent des ordres stop avant de se retourner. Placer votre stop 4 à 5 % au-delà du niveau de cassure évite ces points de liquidation prévisibles.
La volatilité ATR (Average True Range) fournit une approche mathématique pour le placement des stops. Utiliser l’ATR sur 2 périodes comme distance de stop prend en compte la volatilité réelle du marché plutôt que des niveaux de pourcentage arbitraires. Sur une cassure avec un ATR de 120 points, placer un stop de 240 points (2 ATR) fournit un tampon adéquat contre les retournements pilotés par algorithmes.
La « calmie de la mi-journée » (11h30, 14h00 ET) affiche des taux de fausse cassure 35 % plus élevés que les autres sessions en raison d’une participation institutionnelle réduite. Éviter les trades de cassure pendant cette fenêtre améliore les taux de réussite globaux en filtrant les signaux de cassure de moindre qualité. Le contrôle psychologique empêche les violations du guide de gestion des risques plus intelligent, le trading de vengeance après des fausses cassures accumulant rapidement des pertes lorsqu’il est appliqué à des positions à effet de levier.
Transformez vos connaissances en profit
Vous avez lu, il est temps d’agir. La meilleure façon d’apprendre, c’est en pratiquant. Ouvrez un compte démo gratuit et sans risque et entraînez votre stratégie avec des fonds virtuels dès aujourd’hui.
Ouvrir un compte démo gratuitPoints clés
- Le trading de cassure exécute des positions au début de nouvelles tendances de prix, capturant le momentum avant les suiveurs basés sur la confirmation.
- Le seuil de volume de 150 % identifie les cassures institutionnelles et les sépare du bruit des fausses cassures de 70 % sur les graphiques en 1 minute.
- Les algorithmes à haute fréquence génèrent 85 % du volume de cassure, obligeant les traders à prendre en compte les balayages de liquidité algorithmiques et les chasses aux stops.
- Le modèle de cassure et retest augmente le taux de réussite à 68 % en attendant que le prix valide un niveau cassé comme nouveau support ou résistance.
- Le placement de stop-loss basé sur l’ATR protège contre les retournements pilotés par algorithmes en positionnant les stops en dehors des zones de chasse à la liquidité prévisibles.
- Les unités de temps journalières et hebdomadaires réduisent le risque de fausse cassure à 15-25 % lorsqu’elles sont combinées avec la confirmation par le volume, tradant des tendances plus lentes avec une fiabilité plus élevée.
Questions fréquemment posées
Cet article contient des références au trading de cassure et à Volity, une plateforme de trading de CFD réglementée. Ce contenu est produit à des fins éducatives uniquement et ne constitue pas un conseil financier ou une recommandation d’achat ou de vente d’un instrument financier. Vérifiez toujours le statut réglementaire actuel et les détails de la plateforme avant d’utiliser un service de trading. Certains liens dans cet article peuvent être des liens d’affiliation.
Ce que nos analystes surveillent : Trois filtres séparent une cassure tradable d’un balayage de liquidité de chasse aux stops. Le volume sur la bougie de cassure (une vraie cassure imprime un volume au moins 1,5 fois supérieur à la moyenne sur 20 barres ; les cassures sur volume en baisse se retournent environ deux tiers du temps). L’alignement sur des unités de temps supérieures (une cassure en quatre heures qui franchit un niveau de graphique journalier entraîne matériellement plus de suivi qu’une cassure en quatre heures au milieu d’une plage journalière). Le placement du stop en dehors de la liquidité évidente (le stop théorique juste en dessous d’une résistance cassée est le même stop que les algorithmes chassent ; placer le stop un ATR complet au-delà de la ligne, en acceptant la pénalité de taille plus importante, améliore matériellement le taux de réussite en supprimant le balayage facile). Lorsque les trois s’alignent, la cassure est investissable ; lorsque l’un d’eux se détériore, le trader reste les mains sur les genoux et attend.
Volity exploite une plateforme de trading et publie également du contenu éducatif et analytique sur le trading. Le contenu de cette page est uniquement à des fins éducatives et ne doit pas être considéré comme un conseil financier. Volity peut bénéficier commercialement lorsque les lecteurs ouvrent des comptes de trading via les liens présents sur ce site.
Notre contenu est produit et révisé selon des standards éditoriaux documentés ; consultez notre méthodologie de comparaison et de revue.