Bearish candlestick patterns are visual formations on a price chart that signal a potential downtrend reversal or continuation of a downward movement. These patterns are crucial tools within technical analysis, helping traders anticipate shifts in market sentiment from bullish to bearish. Understanding them allows for informed decisions to capitalize on impending price declines. This guide will help you identify the most powerful bearish patterns, confirm their signals, and integrate them into a robust trading strategy with proper risk management.
While understanding Bearish Candlestick is important, applying that knowledge is where the real growth happens. Create Your Free Forex Trading Account to practice with a free demo account and put your strategy to the test.
What are bearish candlestick patterns?
Bearish candlestick patterns are specific formations on a candlestick chart that indicate a potential shift from an uptrend to a downtrend, or the continuation of an existing downtrend. They are generated by the price action of a financial asset, reflecting the struggle between buyers and sellers. These patterns provide visual cues about selling pressure dominating the market, suggesting that prices are likely to fall.
How do bearish candlestick patterns form?
Bearish candlestick patterns form through a sequence of price movements that create distinct shapes on a chart, providing insight into market psychology. Each pattern tells a story of increasing selling pressure and diminishing buying interest. The interplay of open, high, low, and close prices over a specific timeframe defines the candle’s body and wicks, which are critical for pattern recognition.
The Anatomy of a Bearish Candlestick
A bearish candlestick typically features a solid body, often red or black, where the closing price is lower than the opening price. The upper and lower wicks, or shadows, represent the highest and lowest prices traded during the period.
A long upper shadow indicates that buyers attempted to push prices higher but were ultimately rejected by sellers, leading to a close near the low. Conversely, a short or absent lower shadow suggests limited buying interest.
The color and size of the real body, along with the length of the wicks, are key to understanding the underlying price action and market sentiment.
Ready to Elevate Your Trading?
You have the information. Now, get the platform. Join thousands of successful traders who use Volity for its powerful tools, fast execution, and dedicated support.
Create Your Account in Under 3 MinutesWhat do bearish candlestick patterns indicate?
Bearish candlestick patterns indicate a potential trend reversal from an uptrend to a downtrend, or a continuation of a downward move. These formations suggest that selling pressure is overcoming buying pressure, pushing prices lower. They signal a shift in market sentiment, where optimism is fading, and pessimism is growing among traders. Recognizing these patterns allows traders to anticipate future price declines and adjust their trading strategy accordingly.
The Most Powerful Bearish Candlestick Patterns to Watch For
Identifying the most impactful bearish candlestick patterns is essential for traders seeking to anticipate market downturns. While many patterns exist, some consistently provide stronger confirmation signals of a potential trend reversal.
Bearish Engulfing Pattern
The Bearish Engulfing pattern is a powerful bearish reversal pattern and one of the easiest to spot for many traders. It forms when a small bullish candle is completely “engulfed” by a large bearish candle on the following day.
The second candle’s body opens lower than the previous close and closes lower than the previous open, indicating that sellers have aggressively taken control from buyers. This pattern suggests a strong shift in market sentiment and often appears after an uptrend, signaling a high probability of a downtrend reversal.
Dark Cloud Cover
The Dark Cloud Cover is a two-candle bearish reversal pattern that suggests a shift from buying to selling pressure. It begins with a strong bullish candle, followed by a bearish candle that opens above the previous day’s high but closes well within the body of the previous green candle, ideally below its midpoint.
This “dark cloud” penetrating the bullish sentiment indicates that sellers are taking over, pushing prices down from their highs. The deeper the penetration into the bullish candle, the stronger the bearish signal.
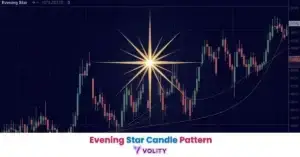
Evening Star
The Evening Star pattern is a three-candle bearish reversal pattern that signals the end of an uptrend. It consists of a large bullish candle, followed by a small-bodied candle (a “star” candle, which can be a Doji or a spinning top) that gaps up, indicating indecision.
The third candle is a large bearish candle that closes well into the body of the first bullish candle, often below its midpoint. This sequence shows an exhaustion of buying pressure, followed by indecision, and then a strong surge of selling pressure.
The Evening Star pattern is considered one of the most reliable bearish reversal patterns, especially when accompanied by high trading volume on the bearish candle.
Shooting Star
A Shooting Star is a single-candle bearish reversal pattern that often appears at the top of an uptrend. It has a small real body (either bullish or bearish), a long upper shadow (at least twice the length of the body), and little to no lower shadow.
This formation indicates that buyers initially pushed prices higher, but sellers aggressively stepped in to reject those higher prices, causing the price to close near its open or low. The long upper shadow represents the rejection of higher prices and a strong selling pressure, signaling a potential downtrend reversal.
Hanging Man
The Hanging Man is a single-candle bearish reversal pattern that forms during an uptrend. It features a small real body (bullish or bearish), a long lower shadow (at least twice the length of the body), and a very short or absent upper shadow.
This pattern suggests that despite initial selling pressure pushing prices down, buyers managed to push the price back up to close near the open. However, the long lower shadow indicates that sellers were active, and the ability of the price to close near the top is a warning sign that buying interest may be waning.
It acts as a warning that selling pressure might be building.
Doji and Gravestone Doji
A Doji candlestick forms when the opening and closing price of an asset are virtually the same, creating a cross or plus sign shape. It signifies market indecision, where neither buyers nor sellers could gain control. While a standalone Doji indicates uncertainty, its appearance at the peak of an uptrend often precedes a downtrend reversal.
The Gravestone Doji is a specific bearish variant of the Doji, characterized by an open, low, and close that are all near the same price, with a long upper shadow.
This indicates that buyers tried to push prices higher, but sellers completely rejected the move, driving the price back down to the open, signaling strong selling pressure and a potential reversal.
Three Black Crows
The Three Black Crows is a powerful three-candle bearish reversal pattern that signals a strong shift in market sentiment. It consists of three consecutive long bearish candles, each opening within the real body of the previous green candle and closing progressively lower.
Each candle’s close should be near its low, with short or absent lower shadows. This pattern demonstrates sustained and increasing selling pressure, indicating that sellers have firmly taken control of the market. It often appears after a prolonged uptrend, signaling a significant downtrend reversal.
Confirming Bearish Signals for Higher Probability Trades
Relying solely on bearish candlestick patterns can lead to false signals and missed opportunities. Successful traders understand that confirmation from other technical indicators and market context significantly increases the reliability of these patterns. Combining multiple analytical tools provides a more robust outlook on market sentiment and potential price movements.
The Role of Volume in Validating Bearish Patterns
Trading volume plays a crucial role in validating bearish candlestick patterns. An increase in volume on the bearish candle(s) that form the pattern acts as a strong confirmation signal. High volume indicates that a significant number of market participants are actively selling, lending more weight to the selling pressure suggested by the pattern.
Conversely, if a bearish pattern forms on low volume, its reliability as a downtrend reversal signal diminishes, suggesting less conviction behind the price move.
Combining with Resistance Levels and Other Indicators
Bearish candlestick patterns are typically more reliable when confirmed by other technical indicators or occurring at significant resistance levels. When a pattern forms at a key resistance level, it indicates that buyers are struggling to push prices higher, and sellers are stepping in at a historically significant price point.
Other indicators can also provide valuable confirmation signals:
- Moving Averages: A bearish pattern forming as price is rejected from a downward-sloping moving average (e.g., 50-day or 200-day) strengthens the signal.
- Relative Strength Index (RSI): An RSI reading above 70 (overbought) that then turns down, coinciding with a bearish pattern, suggests a loss of bullish momentum.
- Moving Average Convergence Divergence (MACD): A bearish crossover on the MACD (MACD line crossing below the signal line) or divergence between price and MACD can confirm the pattern.
By looking for confluence—multiple indicators aligning to suggest a bearish outcome—traders can significantly increase the probability of a successful trade.
How to Trade Bearish Candlestick Patterns
Integrating bearish candlestick patterns into a comprehensive trading strategy requires more than just identification; it demands a structured approach to entry, exit, and crucial risk management. A well-defined strategy helps traders capitalize on downtrend reversal signals while protecting capital.
Optimal Entry and Exit Points
When a bearish candlestick pattern forms, identifying the entry point for a short position is critical. A common strategy is to enter on the open of the candle immediately following the completion of the bearish pattern, or once the price breaks below the low of the pattern’s last candle.
For stop loss placement, a logical location is just above the high of the bearish pattern, or the highest point reached during the pattern’s formation. This ensures that if the pattern fails and the price moves higher, the loss is limited.
Profit targets can be set at the next significant support level or using a fixed risk-reward ratio, such as 1:2 or 1:3.
The Critical Role of Risk Management
Risk management is paramount when trading with candlestick patterns, as no pattern guarantees future price movements, and false signals are inherent in market analysis. To address the common question, “How much should I risk per trade?”, a robust risk management strategy involves position sizing and setting a stop loss order.
A widely accepted guideline is to risk no more than 1% to 2% of your total trading capital on any single trade. For example, if you have a $10,000 trading account, you would risk a maximum of $100 to $200 per trade. This rule, combined with a well-placed stop loss, ensures that even a series of losing trades does not significantly deplete your capital.
Choosing the Right Timeframe for Bearish Patterns
The reliability of bearish candlestick patterns varies significantly across different timeframes. Patterns observed on higher timeframe charts (e.g., daily, weekly) generally provide stronger, more reliable signals than those on lower timeframes (e.g., 5-minute, 15-minute). This is because higher timeframes incorporate more data and are less susceptible to market noise.
Multi-timeframe analysis is an advanced technique that enhances the strength of bearish reversal patterns. This involves identifying a bearish pattern on a higher timeframe (e.g., a daily chart) and then confirming the selling pressure and downtrend reversal on a lower timeframe (e.g., an hourly chart). For instance, a daily Evening Star pattern might be confirmed by a series of bearish candles or a break of a short-term support level on the hourly chart, providing a more precise entry point.
Common Mistakes to Avoid
Traders often make several common mistakes when using bearish candlestick patterns:
Avoiding these pitfalls is crucial for long-term success when incorporating these patterns into your trading strategy.
Addressing False Signals and Psychological Biases
Even the most reliable bearish candlestick patterns can produce false signals, leading to frustration and losses. Successful trading with these patterns requires not just technical skill, but also a robust understanding of market context, the ability to filter out false signals, and disciplined emotional control. Addressing these challenges is paramount for consistent profitability.
Understanding and Mitigating False Signals
A common question among traders is, “Do bearish patterns always work?” The answer is no; no pattern is 100% accurate, and false signals are an inherent part of market analysis. False signals occur due to market noise, unexpected news, or temporary volatility.
To mitigate their impact, traders should:
- Seek Confirmation: Always look for confirmation signals from other indicators like volume, resistance levels, or momentum oscillators (RSI, MACD).
- Consider Context: A pattern’s significance is amplified when it appears at a key resistance level or after a prolonged uptrend, rather than in choppy, sideways markets.
- Use Multi-timeframe Analysis: Confirming a pattern across different timeframes can filter out weaker signals.
Wait for Breakouts: Sometimes, waiting for the price to break a critical support level after* the pattern forms provides stronger confirmation.
The Impact of Psychological Bias on Trading Decisions
“What if a pattern forms but the price goes up?” This question often stems from psychological bias, which can significantly impact trading decisions even when a clear bearish candlestick pattern emerges. Common biases include:
- Confirmation Bias: Seeking out and interpreting information that confirms existing beliefs while ignoring contradictory evidence. This can lead traders to misinterpret a pattern as bearish even when other signals suggest otherwise.
- Fear of Missing Out (FOMO): Rushing into a trade without proper confirmation due to the fear of missing a potential move.
- Anchoring Bias: Over-relying on the first piece of information encountered, such as an initial bullish sentiment, even when new bearish patterns emerge.
- Revenge Trading: Trying to recoup losses by taking impulsive, poorly planned trades after a false signal or losing streak.
To maintain discipline and emotional control, traders should stick to a predefined trading strategy, keep a trading journal to track decisions and emotions, and understand that losses are a normal part of trading. This helps to objectively assess the candlestick chart meaning and avoid reactive decisions.
Turn Knowledge into Profit
You've done the reading, now it's time to act. The best way to learn is by doing. Open a free, no-risk demo account and practice your strategy with virtual funds today.
Open a Free Demo AccountThe Importance of Backtesting and Practice
Before relying on any bearish candlestick pattern in live trading, systematic backtesting and simulation are essential to understand its historical efficacy and personal performance. This crucial step provides a data-driven approach to refine your trading strategy and build confidence.
What is Backtesting and Why is it Essential?
Backtesting is the process of testing a trading strategy or pattern using historical data to determine its viability. It involves applying your specific rules for identifying bearish candlestick patterns, setting entry points, stop loss placement, and profit targets to past price movements. The goal is to assess how the strategy would have performed historically, revealing its potential profitability, drawdown, and win rate.
Backtesting trading strategies, including those based on bearish candlestick patterns, is a critical step to assess their historical performance and adjust parameters for different market conditions. It builds confidence in your chosen patterns and helps you understand their strengths and weaknesses in various market environments.
How to Effectively Backtest Bearish Candlestick Patterns
To effectively backtest bearish candlestick patterns, follow these steps:
- Manual Backtesting: Scroll through historical charts, identify patterns, and record outcomes. This is time-consuming but builds intuition.
- Automated Backtesting: Use trading software or platforms that allow you to program your rules and run simulations.
Regular practice, combined with systematic backtesting, ensures that your understanding of bearish candlestick patterns is grounded in evidence and tailored to your specific trading context.
Bottom Line
Mastering bearish candlestick patterns is a powerful skill for any trader engaged in technical analysis. These patterns, from the decisive Bearish Engulfing pattern to the warning Evening Star, provide critical visual cues about impending downtrend reversal or continuing selling pressure.
However, their true value is unlocked not in isolation, but through rigorous confirmation signals like trading volume and resistance levels. Implementing a robust risk management strategy with precise stop loss placement and position sizing is non-negotiable for capital preservation. Furthermore, understanding and mitigating false signals and psychological bias is crucial for long-term consistency.
Finally, systematic backtesting and continuous practice are essential to validate your approach and build unwavering confidence in your trading strategy.
Key Takeaways
- Bearish candlestick patterns are crucial for identifying potential downtrend reversals in technical analysis.
- Always confirm patterns with indicators like volume and resistance levels, and implement strict risk management.
- Mitigate false signals and psychological biases through disciplined trading and continuous backtesting.