The **Bull Flag Pattern** is a reliable continuation pattern in technical analysis, signaling a temporary pause in a strong uptrend before prices resume their climb. It features a sharp price increase (the “pole”) followed by a downward-sloping consolidation (the “flag”). This guide will teach you to identify valid Bull Flag setups, calculate precise price targets, and implement robust risk management strategies to capitalize on market momentum.
While understanding Bull Flag Pattern is important, applying that knowledge is where the real growth happens. Create Your Free Forex Trading Account to practice with a free demo account and put your strategy to the test.
What is a bull flag pattern?
The Bull Flag pattern is a highly regarded chart formation that signals the continuation of an established upward trend. It typically appears after a significant price surge, representing a temporary breather where the market consolidates before resuming its upward trajectory.
Its bullish nature indicates that despite a brief pullback, the underlying buying pressure remains strong, preparing for another leg higher.
How does a bull flag pattern form?
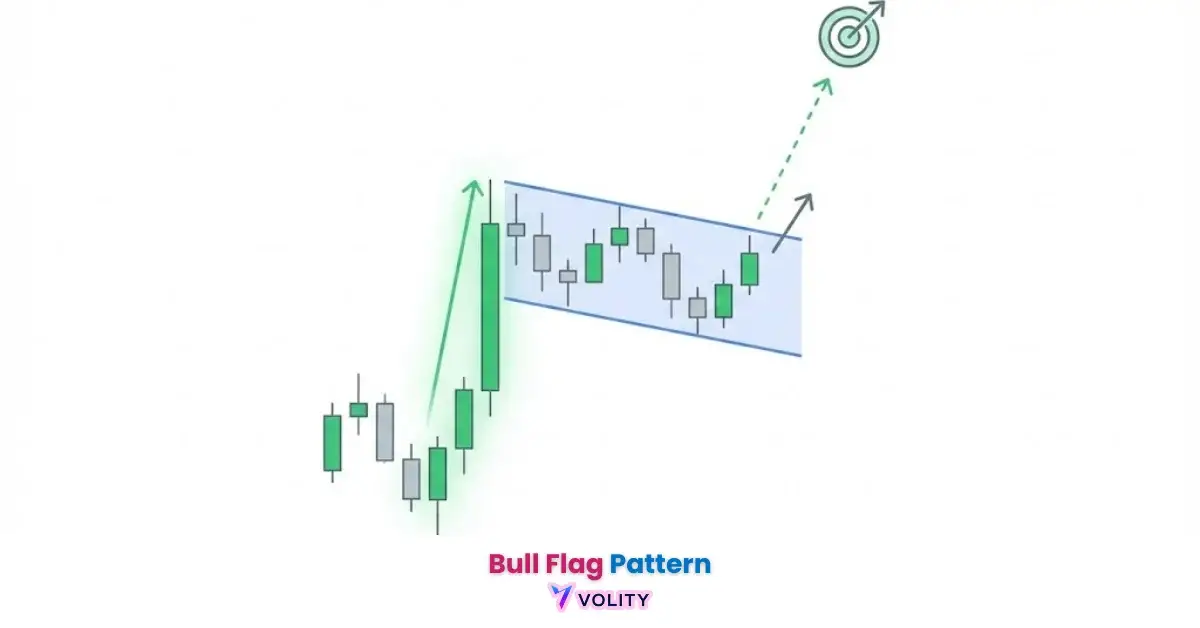
A Bull Flag pattern forms in two distinct phases: the “pole” and the “flag.” The pole is characterized by a sharp, almost vertical price increase, indicating strong buying interest and the initial phase of an uptrend. Following this aggressive move, the market enters a consolidation phase, forming the flag.
This flag typically takes the shape of a small, downward-sloping rectangle or channel. During this period, price action moves within parallel trend lines, reflecting temporary profit-taking or a pause in buying before the trend continues.
What are the characteristics of a bull flag?
The Bull Flag pattern’s core characteristics provide clear identification signals for traders. These include a strong initial price surge (the pole), followed by a period of consolidation where the price drifts slightly lower or sideways.
The flag itself is typically a small, contained pattern that slopes against the prevailing uptrend, often resembling a rectangular shape. Volume tends to decrease during the flag’s formation, indicating a lack of strong selling pressure, and then increases significantly upon a breakout.
This combination of price action and volume profile confirms the pattern’s validity and its potential for a further upward move.
How to Trade the Bull Flag Pattern
Trading Bull Flags requires precise identification, understanding volume dynamics, and strategic entry and exit points. Waiting for confirmation and managing risk effectively are key to capitalizing on the pattern’s continuation potential. This section explores how to pinpoint valid setups, interpret crucial volume signals, and implement robust risk controls with stop-loss orders.
How do you identify a bull flag pattern?
Identifying a valid Bull Flag pattern involves recognizing its distinct two-part structure and waiting for a clear breakout. First, look for a strong, almost vertical price rally forming the “pole.” This initial surge should be significant and sustained.
Next, observe the subsequent consolidation phase, where the price moves within a downward-sloping channel or rectangle, forming the “flag.” To confirm the pattern, draw trend lines connecting the highs and lows of this consolidation. The ideal entry point occurs when the price breaks decisively above the upper trend line of the flag.
The Role of Volume in Bull Flag Confirmation
Volume confirms the validity of a Bull Flag pattern. During the formation of the flag (the consolidation phase), volume typically decreases. This reduction in trading activity signals minimal selling pressure, indicating the market is merely pausing rather than reversing.
The critical confirmation signal comes when the price breaks out of the flag, with volume increasing significantly on this breakout. This surge in volume indicates strong buying interest and confirms that the uptrend is likely to continue, providing conviction for the trade.
Strategic Entry Points and Essential Stop Loss Placement
A common entry point is immediately upon a confirmed breakout above the flag’s upper trend line, ideally accompanied by increased volume. Some traders prefer to wait for a retest of the broken trend line as support before entering, which can offer a lower-risk entry, though it risks missing the move. A logical stop-loss placement is typically just below the low of the flag pattern or below the breakout candle’s low, protecting capital if the pattern fails.
What timeframes are best for bull flag patterns?
Bull Flag patterns are fractal, meaning they can appear across various timeframes, from intraday charts (e.g., 5-minute, 15-minute) to daily, weekly, and even monthly charts. The best timeframes depend on a trader’s style and objectives. Shorter timeframes offer more frequent trading opportunities but can be more susceptible to noise and false signals.
Longer timeframes, such as daily or weekly charts, tend to produce more reliable patterns and larger price moves, though with fewer occurrences. For beginners, focusing on daily or 4-hour charts often provides a good balance between signal reliability and trading frequency.
Ready to Elevate Your Trading?
You have the information. Now, get the platform. Join thousands of successful traders who use Volity for its powerful tools, fast execution, and dedicated support.
Create Your Account in Under 3 MinutesCalculating Bull Flag Price Targets
One of the most appealing aspects of the Bull Flag pattern is its ability to provide a clear price target projection. This allows traders to quantify potential profits and manage trades with a defined objective. Calculating an accurate price target is essential for maximizing gains and establishing a favorable risk-reward ratio.
A common method for calculating a bull flag price target is to measure the length of the ‘pole’ and project it from the breakout point. To execute this pole measurement method, first, identify the pole of the Bull Flag pattern, which is the initial strong upward move. Measure the vertical distance from the beginning of this sharp rally to the highest point before the consolidation phase begins. Once the price breaks out of the flag pattern, project this measured pole length upwards from the breakout point (the point where the price clears the flag’s upper trend line). This projected level serves as the price target.
| Step | Action | Description |
| 1 | Identify Pole | Measure initial strong upward move. |
| 2 | Measure Pole Length | Calculate vertical distance of pole. |
| 3 | Identify Breakout | Pinpoint where price clears flag’s upper trend line. |
| 4 | Project Target | Add pole length to breakout point. |
Considering Multiple Price Target Scenarios
While the pole measurement method provides a primary price target, traders often consider multiple scenarios to refine their profit-taking strategy. This can involve setting partial profit targets at intermediate resistance levels or using Fibonacci extensions from the pole’s swing points as secondary confirmations.
For instance, a trader might take 50% of their profits at the initial pole projection and let the remaining position run towards a Fibonacci extension level. Adjusting price targets based on market conditions, such as strong overhead resistance or a weakening trend, can help optimize profit maximization.
Advanced Tactics & Risk Management
Sophisticated Bull Flag trading involves integrating advanced tactics and robust risk management. This includes understanding how different indicators can confirm the pattern, its applicability across various asset classes, and critically, how to allocate capital to protect against losses.
Implementing Robust Risk Management with Bull Flags
Risk management is paramount when trading Bull Flags, as even reliable patterns can fail. Effective risk management, including proper stop-loss placement, is crucial to mitigate potential losses when trading chart patterns.
Traders should determine their capital allocation strategy, typically risking no more than 1-2% of their total trading capital on any single trade. This involves calculating appropriate position sizes based on the distance between the entry point and the stop loss.
A favorable risk-reward ratio, often 1:2 or higher, means potential profits are at least twice the potential loss.
| Risk Factor | Description | Example |
| Risk Per Trade | Max % of capital risked | 1-2% |
| Position Sizing | Shares/contracts based on stop | (Capital * Risk %) / Stop Loss |
| Risk-Reward | Potential gain vs. loss | 1:2 (e.g., $100 loss for $200 gain) |
| Stop Loss | Automatic exit point | Below flag’s low |
RSI and Moving Averages with Bull Flags
Integrating technical indicators can improve Bull Flag trade reliability. The Relative Strength Index (RSI) can confirm momentum, showing if the initial pole was truly strong and if the consolidation phase (flag) represents a healthy pullback without significant bearish divergence.
For instance, if RSI stays above 40-50 during the flag, it suggests underlying strength. Moving Averages can act as dynamic support levels. Price often finds support at a 20-period or 50-period moving average during the flag’s formation, further confirming bullish sentiment and providing potential additional entry points.
Can you trade bull flags on any asset (stocks, crypto, forex)?
Bull Flag patterns are universal and can be traded across a wide range of financial markets, including stocks, forex, and cryptocurrencies. The underlying principles of supply and demand driving the pattern are present in all these markets. However, traders should consider nuances for each asset class.
In forex, liquidity and volatility can impact breakout strength. In cryptocurrencies, extreme volatility might lead to more frequent false breakouts or larger price swings, requiring tighter risk management. For stocks, understanding sector trends and company news can provide additional context.
A Visual Comparison
Understanding the subtle differences between continuation patterns is crucial for accurate trading decisions. While the Bull Flag pattern signals a bullish continuation, its counterparts, the Bear Flag pattern and Pennant pattern, indicate different market dynamics. This comparison highlights their key distinctions.
| Pattern | Trend | Flag Shape | Volume Profile | Implications |
| Bull Flag | Uptrend | Downward-sloping rectangle | Decreases in flag, increases on breakout | Bullish continuation |
| Bear Flag | Downtrend | Upward-sloping rectangle | Decreases in flag, increases on breakdown | Bearish continuation |
| Pennant | Uptrend or Downtrend | Symmetrical triangle | Decreases in pennant, increases on breakout/down | Continuation (either direction) |
Common Pitfalls & How to Avoid Them
Despite their reliability, Bull Flag patterns are not foolproof, and traders can encounter several pitfalls, including false breakouts. Recognizing these common mistakes and understanding their psychological impact is vital for improving trading consistency and protecting capital.
Why do my bull flags often fail after breakout?
Bull Flags often fail after a breakout primarily due to a lack of strong confirmation or insufficient underlying buying pressure. A common reason for failure is a false breakout, where the price briefly moves above the flag’s upper trend line but quickly reverses back into the pattern or even below it.
This usually occurs without a significant increase in volume on the initial breakout. Another factor is a weak overall market sentiment, which can undermine even technically strong patterns.
To avoid this, always wait for a decisive candle close above the flag and ideally, a retest of the broken trend line acting as support, accompanied by strong volume.
What are common mistakes when trading bull flags?
Common mistakes when trading Bull Flags include chasing price without proper confirmation, leading to entries at unfavorable levels. Another error is poor stop-loss placement, either too tight (leading to premature exits) or too wide (exposing too much capital). Ignoring volume signals, such as a lack of increased volume on the breakout, is a significant oversight.
The Pre-emption Strategy, where traders enter before a confirmed breakout hoping for a better price, often results in being caught in false breakouts. Over-trading and emotional decisions also contribute to losses.
What’s the psychological impact of false breakouts on traders?
The psychological impact of false breakouts on traders can be significant, leading to frustration, doubt, and potentially revenge trading. When a seemingly perfect Bull Flag setup results in a false breakout, traders may experience a sense of betrayal by the market, eroding confidence in their analytical skills.
Emotional decisions, such as chasing breakouts or not adhering to stop-loss orders, are significant contributors to trading losses for beginners. This can trigger impulsive actions, like immediately entering another trade without proper analysis (“revenge trading”) to recover losses, or widening stop losses out of fear, which often exacerbates the initial loss.
Maintaining discipline and strictly adhering to a predefined trading plan, even after a losing trade, is crucial for managing these emotions.
Turn Knowledge into Profit
You've done the reading, now it's time to act. The best way to learn is by doing. Open a free, no-risk demo account and practice your strategy with virtual funds today.
Open a Free Demo AccountThe Role of Market Sentiment in Bull Flag Success Rates
While technical analysis focuses on price charts, the broader market sentiment plays a significant, often overlooked, role in Bull Flag pattern success rates. Understanding overarching market sentiment can significantly improve Bull Flag success rates, especially in volatile conditions. Traders often observe that their Bull Flags fail in choppy markets but work great in strong trends, indicating the influence of sentiment.
Market sentiment refers to the overall attitude of investors toward a particular security or financial market. A bullish sentiment environment, characterized by positive economic news, low volatility (e.g., a low VIX index), and an overall upward trend in major indices, creates a fertile ground for Bull Flags to succeed.
In such an environment, buying pressure is generally strong, making it more likely for the pattern to resolve upwards. Conversely, a bearish or choppy market, marked by uncertainty or fear, can undermine even well-formed technical patterns.
By aligning trades with the prevailing market sentiment, traders can increase the probability of a successful Bull Flag breakout, adding a layer of strategic thinking to their technical analysis.
Bottom Line
The Bull Flag pattern remains one of the most reliable continuation patterns in technical analysis, offering clear opportunities for profitable trading. Its distinct structure, comprising a strong pole and a consolidation phase flag, provides identifiable entry and exit signals.
Successful trading hinges on waiting for confirmed breakouts with increased volume, calculating price targets using the pole measurement method, and implementing strict risk management with precise stop-loss placement. Overcoming common pitfalls like false breakouts and understanding the psychological impact of losses are also critical for long-term success.
By integrating broader market sentiment into analysis, traders can further improve their ability to capitalize on this powerful pattern across various financial markets.
Key Takeaways
- The Bull Flag pattern is a highly reliable bullish continuation signal.
- Volume confirmation (decreasing in flag, increasing on breakout) is crucial.
- Price targets are calculated by projecting the pole’s length from the breakout point.
- Risk management, including strategic stop-loss placement, is essential for every trade.
- Understanding market sentiment can significantly improve the pattern’s success rate.