Ichimoku Kinko Hyo is a technical indicator designed to reveal trend direction, price momentum, and key support and resistance levels—all in one chart.
It plays a strategic role in Forex trading by helping traders identify high-probability setups, reduce noise, and anticipate future market behavior through its forward-shifted cloud. Within the broader family of forex indicators, Ichimoku stands out as a complete toolkit on its own. But there’s a strategic method for using it the right way.
While understanding Ichimoku Kinko Hyo is important, applying that knowledge is where the real growth happens. Create Your Free Forex Trading Account to practice with a free demo account and put your strategy to the test.
How Does Ichimoku Kinko Hyo Work in Forex Trading?
Goichi Hosoda, a Japanese journalist, created Ichimoku Kinko Hyo to give traders a full market view in one glance. He built it to combine trend direction, support, resistance, and momentum—all in one chart. After 30 years of testing, he published the system in the 1960s.
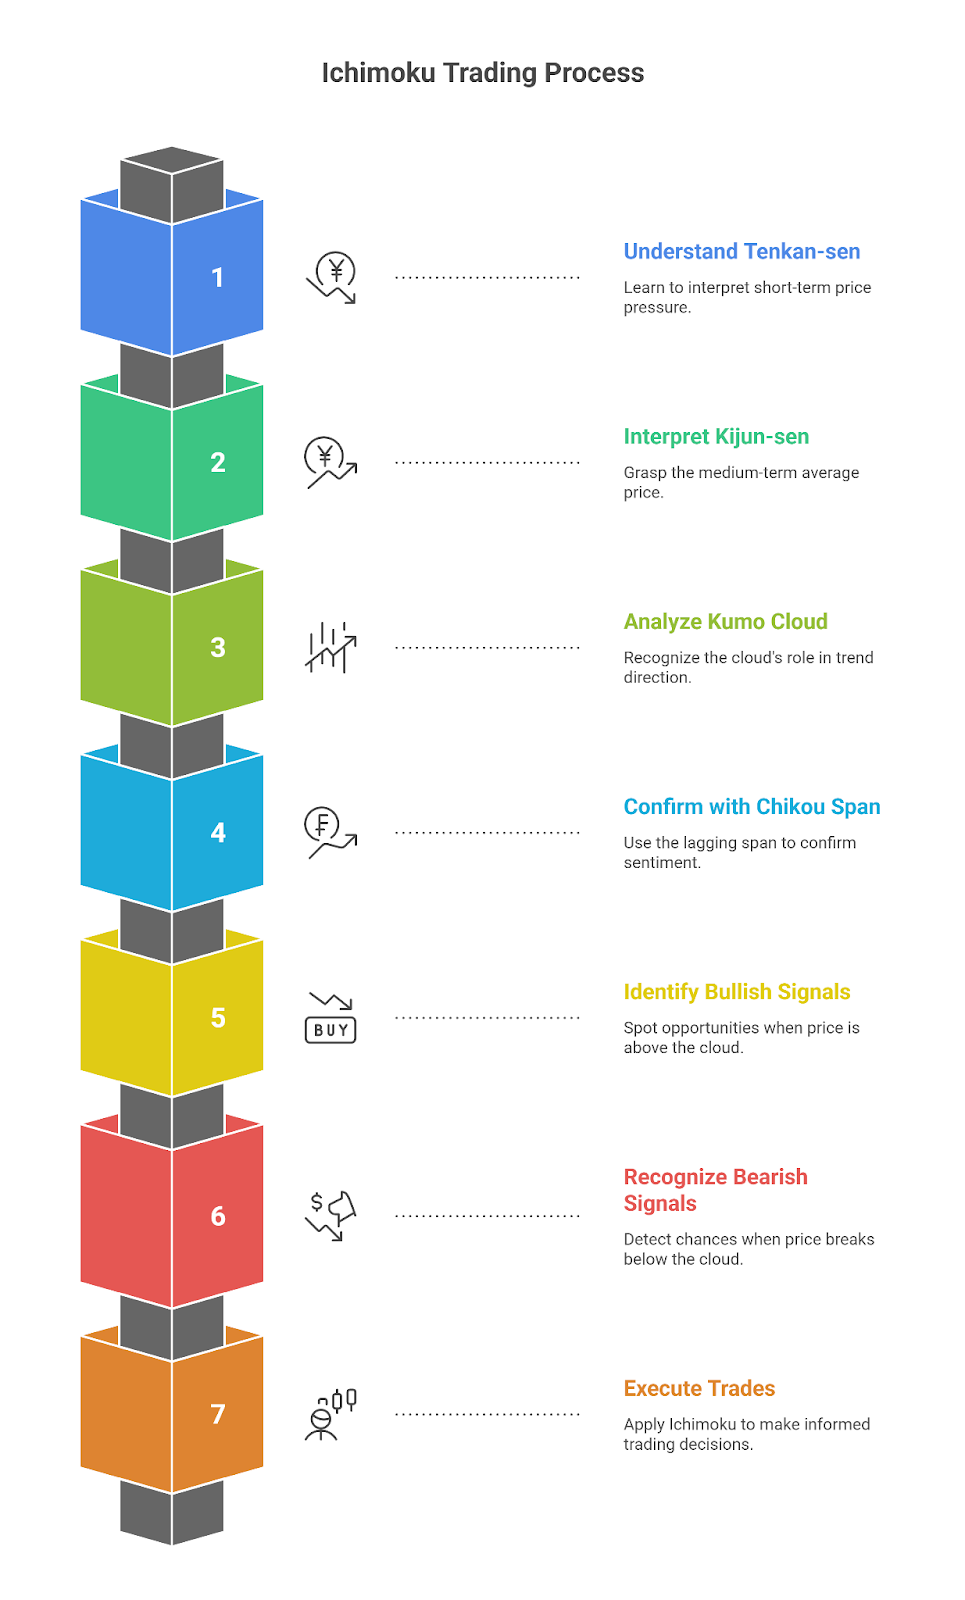
So, Ichimoku Kinko Hyo, a Japenese charting system works using five lines:
- Tenkan-sen (conversion line) shows short-term price pressure.
- Kijun-sen (base line) reflects the medium-term average.
- Senkou Span A and B form the Kumo cloud, which shifts forward.
- Chikou Span lags behind and confirms sentiment.
For instance, if you trade USD/JPY and the price stays above the cloud, the trend is bullish. You can enter a buy when Tenkan crosses above Kijun while the price remains above the Kumo. That confirms upward momentum.
Or let’s say EUR/JPY breaks below the cloud, and Chikou Span drops under past prices. That shows bearish momentum. You can use that to prepare a sell entry, setting your stop just above the cloud.
The system gives clear zones for entry, exit, and stops—all in one view. It filters out noise and keeps focus on high-probability trend setups.
Ichimoku Kinko Hyo vs Other Major Technical Indicators
| Aspect | Ichimoku Kinko Hyo | Moving Averages (MA) | RSI | MACD |
| Purpose | Trend + Momentum + S/R | Trend direction | Momentum strength | Trend and momentum |
| Components | 5 lines including Kumo cloud | 1-2 lines (SMA/EMA) | Single oscillator line | MACD line, Signal line, Histogram |
| Forward Projection | Yes (Cloud shifted forward) | No | No | No |
| Trend Clarity | High in trending markets | Medium | Low | Medium to high |
| Momentum Detection | Integrated via Tenkan/Kijun cross | Indirect via slope | Primary use | Core function |
| Signal Timing | Moderate delay | Lagging | Fast | Moderate lag |
| Noise Filtering | Strong | Weak in volatile markets | Weak | Moderate |
| Visual Complexity | High | Low | Low | Moderate |
| Best Use Case | Trend following, swing trading | Trend confirmation | Overbought/oversold levels | Trend reversals, divergence detection |
How to Understand Each Line in the Ichimoku System?
The Ichimoku system includes five key lines, each of which gives you a direct signal—either trend direction, momentum strength, or market balance. You can analyze them one by one to understand where the price stands and what comes next.
Tenkan-sen (Conversion Line)
Formula: (9-period high + 9-period low) ÷ 2
Tenkan-sen reflects short-term price momentum. The line sits closer to price action than others.
For instance, in the EUR/USD chart, price climbs fast and prints new highs over nine periods. Tenkan-sen rises quickly. That movement shows aggressive buyers in control. When price pulls back and touches Tenkan-sen, many traders prepare to enter long trades.
When Tenkan-sen flattens, you get a signal of short-term range formation. That often means momentum has paused.
Kijun-sen (Base Line)
Formula: (26-period high + 26-period low) ÷ 2
Kijun-sen measures the medium-term market equilibrium. It responds slower than Tenkan-sen.
For instance, in GBP/JPY, Tenkan-sen crosses above Kijun-sen. Price holds above both. That move shows bullish pressure building. When Kijun-sen stays flat, the market consolidates around that level. Many traders use Kijun-sen as a support line in bullish trades or as a stop-loss base.
When price closes below Kijun-sen after a long uptrend, that break often starts a correction or reversal.
Senkou Span A (Leading Span A)
Formula: (Tenkan-sen + Kijun-sen) ÷ 2, projected 26 periods ahead
Span A creates the upper boundary of the Ichimoku cloud in a bullish setup.
For instance, USD/JPY moves higher. Tenkan-sen and Kijun-sen both rise. Span A pulls away from Span B and moves upward. The gap between Span A and Span B gets wider. That cloud expansion confirms strong upside control. Traders look for fresh entries above the cloud when Span A steepens.
When Span A turns down and cuts below Span B, the cloud flips bearish.
Senkou Span B (Leading Span B)
Formula: (52-period high + 52-period low) ÷ 2, projected 26 periods ahead
Span B builds the slower boundary of the cloud. It reflects long-term value.
For instance, EUR/JPY trades inside a tight range. Span B flattens. Price revisits that flat line again and again. That flat Span B becomes a future support or resistance point. Traders often take profits at Span B or set entries when price returns to that zone.
A rising Span B points to longer-term strength. A falling Span B marks long-term bearish weight.
Chikou Span (Lagging Span)
Formula: Today’s closing price, plotted 26 periods back
Chikou Span checks if the current price holds strength compared to the past.
So for instance, AUD/JPY pushes above the cloud. Chikou Span rises and floats above previous candles. That position shows strong market confidence. When Chikou Span dips under old candles, the setup weakens. That confirms trend loss or possible reversal.
Chikou Span also acts as dynamic support and resistance when it lines up with past highs or lows.
Reading All Lines Together
You must understand that strong bullish signals form when:
- Price stays above the cloud
- Tenkan-sen stays above Kijun-sen
- Span A holds above Span B
- Chikou Span floats above past candles
That full alignment signals clean trend momentum. You can plan your entry on pullbacks to Tenkan-sen or Kijun-sen. You can trail stop-losses using Span B or flat Kijun-sen.
When signals reverse—Tenkan dips below Kijun, price breaks below cloud, and Chikou cuts under past prices—the trend flips bearish. You can prepare exit or reversal trades based on which lines break first.
How to Read the Ichimoku Cloud for Market Structure?
Start by looking at the cloud itself because that’s exactly where market structure begins.
The cloud, also called the Kumo, stretches forward. It doesn’t just show where the price has been. It shows where pressure might build. That future projection gives Ichimoku its edge. Other indicators react. Ichimoku prepares.
Now, notice the cloud has two lines. The top one is Senkou Span A. The lower one is Senkou Span B. The space between those lines creates the cloud body.
Let’s break each part down.
First — what does price above the cloud mean?
When candles form above the cloud, bulls hold control. Structure supports higher moves. You mark the top of the cloud as dynamic support. Price often pulls back to Span A, touches it, and continues higher.
Suppose EUR/JPY trades above a thick cloud. You wait. Price pulls back into the upper edge. Then a bullish candle prints. That’s your sign. Structure held. Bulls returned.
What about price inside the cloud?
Inside the cloud, the structure breaks down. Buyers and sellers fight. Trends slow. You don’t rush here. You stay patient. Wait for clarity. Let price show strength before making any move.
Let’s say AUD/USD drops from above the cloud into the Kumo. Span A turns flat. Span B stays wide. That’s indecision. You avoid guessing. You wait for a breakout from the cloud before planning your next step.
Now — when price drops below the cloud?
That confirms bearish control. Sellers dominate. You look too short on rallies. The bottom edge of the cloud becomes resistance. Span B often forms that barrier.
For example, GBP/USD trades below a falling cloud. Span B holds strong. Price tries to rise but stalls near the cloud’s bottom. You watch for a rejection candle. Once that prints, you get a clean short opportunity.
One more key idea — the thickness of the cloud.
A thick cloud means strong structure. Buyers or sellers won’t give up that zone easily. Thin clouds offer little protection. Price slices through them quickly.
USD/CHF forms a thick cloud while trending up. Price drops toward it. Bounces sharply from Span A. That confirms strength. In contrast, NZD/JPY builds a thin cloud. Price dips and cuts right through. Thin structure failed. New trend begins.
Finally — look at the angle.
Cloud slope confirms momentum. Rising slope supports bullish trades. Falling slope backs bearish setups. A flat cloud signals balance. That’s your warning: stay out unless something changes.
How to Identify Forex Trends Using Ichimoku?
Let’s walk through how you can identify bullish or bearish trends using the core components of Ichimoku Kinko Hyo.
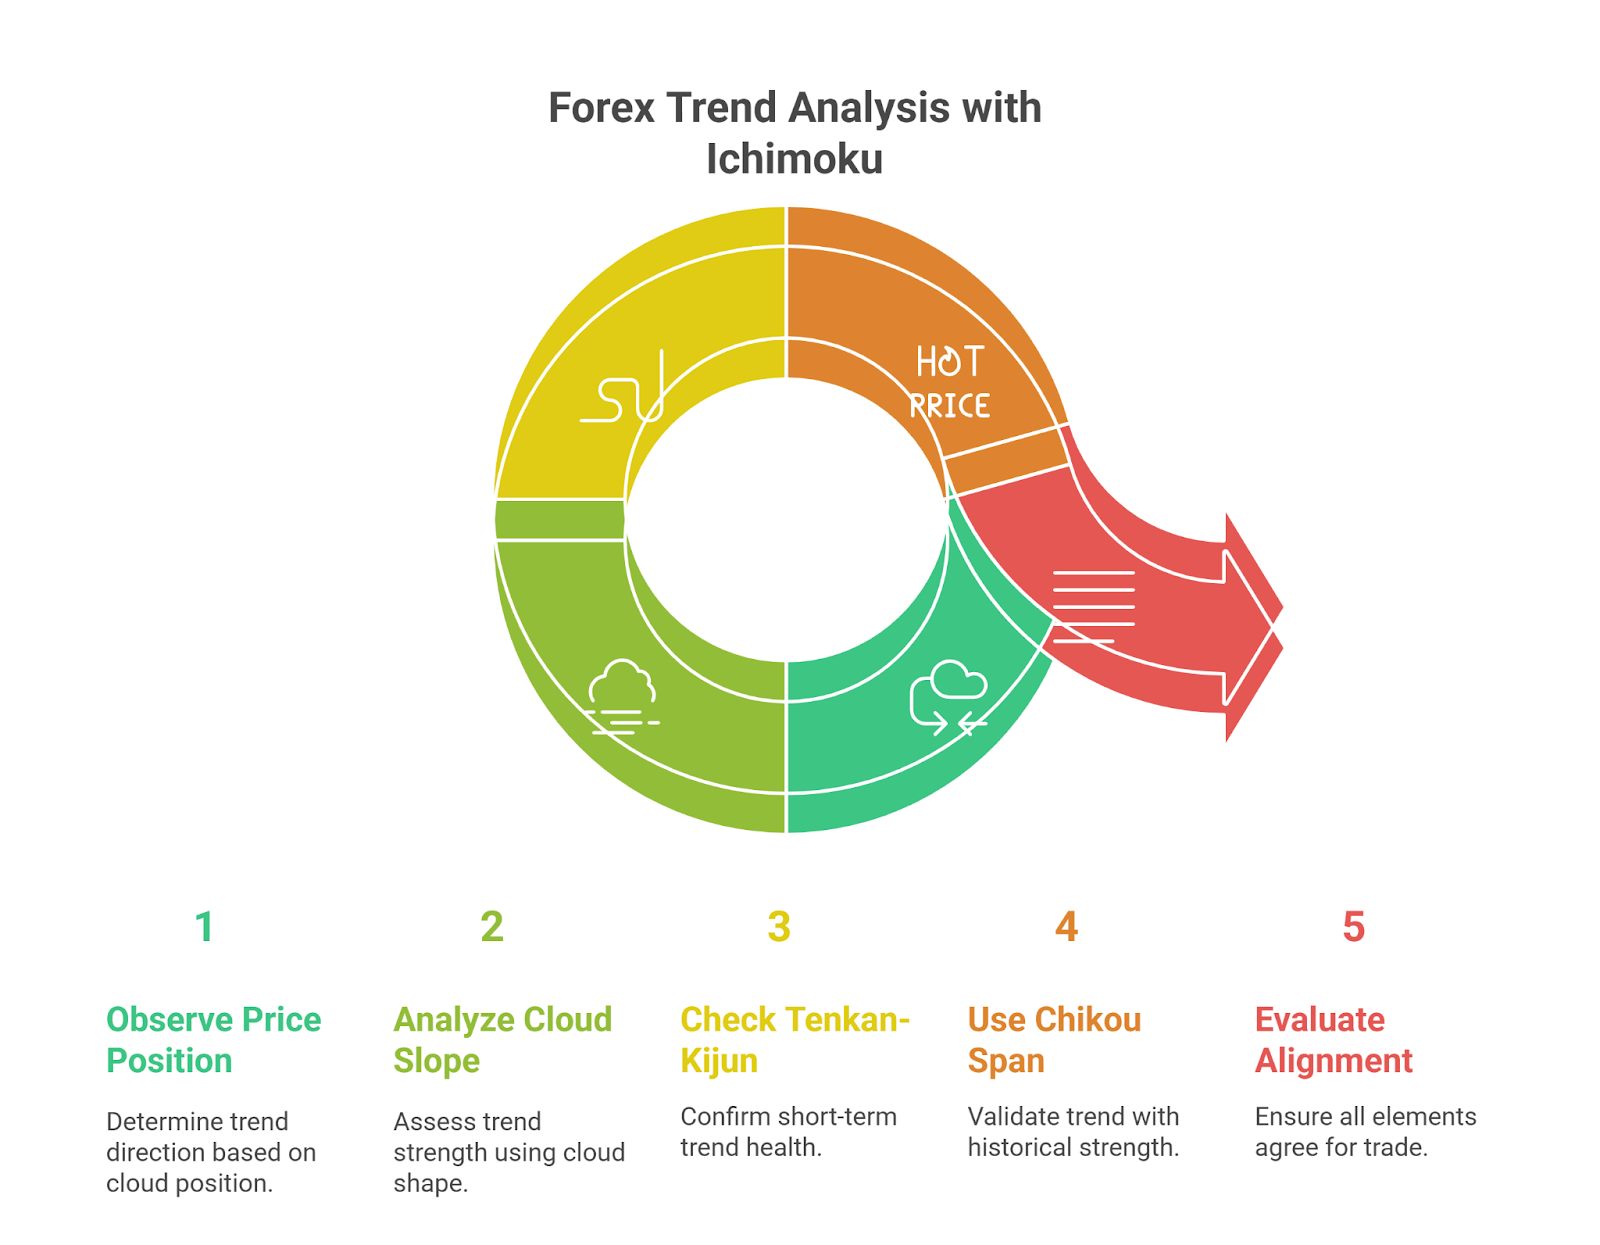
Step 1: Look at the Position of Price Against the Cloud
Start with the most visible clue. Yes, you need to look at where price sits in relation to the cloud.
- Price above the cloud = Uptrend
- Price below the cloud = Downtrend
- Price inside the cloud = No clear trend (range or consolidation)
For example, on the USD/JPY daily chart, price closes above the entire cloud. See, that confirms trend bias is upward. You can avoid shorting and begin watching for long setups only.
Step 2: Confirm with Span A and Span B Slope
The shape and slope of the cloud matter as it tells you about the trend’s strength.
- Both Span A and Span B sloping upward = Strong uptrend
- Both sloping downward = Strong downtrend
- Flat cloud = Weak trend or potential reversal
For example, AUD/USD shows Span A moving above Span B, both sloping upward. The cloud widens and that slope confirms a growing bullish trend.
Step 3: Check the Tenkan-Sen and Kijun-Sen Relationship
Because this shows you the short-term trend health.
- Tenkan above Kijun = Bullish signal
- Tenkan below Kijun = Bearish signal
- When both lines follow price cleanly without crossing, it shows strong continuation.
For example, on EUR/JPY, Tenkan crosses above Kijun while price remains above the cloud. That’s a strong confirmation of a fresh bullish leg.
Step 4: Use the Chikou Span (Lagging Line) for Confirmation
The Chikou Span tells you whether the trend has historical strength behind it.
- Chikou above price (26 periods back) = Bullish
- Chikou below price = Bearish
- Chikou tangled in candles = Unclear market, stay cautious
For example, GBP/USD rallies above the cloud. Chikou Span sits cleanly above price action from 26 candles ago. That confirms bullish dominance across past and present.
Step 5: Evaluate the Entire Picture
Only act when all elements align:
- Price above the cloud
- Span A above Span B
- Tenkan above Kijun
- Chikou above past price
If all signs agree, you can trade in the trend’s direction. If even one element disagrees, wait or reduce position size.
For example, NZD/JPY shows price above cloud, Tenkan above Kijun, Chikou above price, and a wide upward cloud. That’s a textbook bullish trend.
Ready to Elevate Your Trading?
You have the information. Now, get the platform. Join thousands of successful traders who use Volity for its powerful tools, fast execution, and dedicated support.
Create Your Account in Under 3 MinutesHow to Spot Entry Signals with Ichimoku Rules?
Ichimoku can goes way beyond simply acting as a trend indicator. It can give you actual trade signals—clear setups where market structure, momentum, and confirmation all come together. But you need to know when those signals truly matter. Let’s walk through how to spot valid entries using strict Ichimoku rules.
1. Tenkan-Kijun Cross: Your First Trigger
Start with the cross between the Tenkan-sen (conversion line) and Kijun-sen (base line). Because this is your signal generator.
- A bullish entry happens when Tenkan crosses above Kijun.
- A bearish entry forms when Tenkan drops below Kijun.
But here’s the condition: you only take the trade if the cross occurs above the cloud for longs or below the cloud for shorts. Crosses inside the cloud signal indecision and often trap traders.
For example, EUR/JPY is on the 4H chart. Price floats above the cloud. Tenkan cuts cleanly above Kijun. That’s your go. It means momentum aligns with structure.
2. Cloud Breakout: The Structure Confirmed
Next, look at price itself. If it breaks above the cloud with a strong candle, you get structural confirmation for a long setup. If it drops below, the trend flips bearish. Wait for a decisive close—not just a wick piercing the cloud. You want a strong candle body above or below the Kumo.
For example, USD/CHF closes above a thick cloud after days of consolidation. You spot the break, and momentum builds. The breakout isn’t just random—it confirms buyers stepped in.
3. Cloud Alignment: Span A and Span B
Inside the cloud, you have two lines: Senkou Span A and Senkou Span B.
For a long trade:
- Span A must be above Span B.
For a short trade:
- Span A must be below Span B.
This sets the cloud’s direction. It shows whether buyers or sellers dominate the future.
Tip: Don’t enter trades when Span A and Span B are flat or overlapping. That means low conviction.
4. Chikou Span: Past Always Matters
Traders often skip the Chikou Span—but you shouldn’t. It’s your confirmation filter. Chikou Span is the current price, plotted 26 periods behind. It must be:
- Above price candles for a bullish trend.
- Below price candles for a bearish one.
When Chikou Span runs free—without intersecting old candles—you get clean trend strength.
For example, on GBP/USD, Chikou Span floats above past 26 candles. That confirms clean bullish sentiment. It clears hesitation and gives your entry more confidence.
5. All Lines Must Agree
One signal never works alone. Ichimoku is a system. Before you act:
- Make sure price sits clearly above or below the cloud.
- Confirm Tenkan-Kijun crossover.
- Check Span A > Span B for longs.
- Validate that Chikou Span supports the trend.
When all the parts align, that’s when Ichimoku delivers and gives you a green light.
How to Build a Forex Strategy Around Ichimoku?
Okay, so first of all, you need to stop thinking of Ichimoku as a single technical indicator. It is a complete system. It shows trend direction, market momentum, support zones, resistance ceilings, and timing cues — all in one view. So, instead of combining five different tools, you can build one sharp, structured strategy just around Ichimoku.
Start with the Right Timeframe
Yes, you can run Ichimoku on any chart, but it makes the most sense on higher timeframes like 1H, 4H, or Daily. That’s where the signals get cleaner, and noise gets filtered out.
Use this simple breakdown:
- Daily chart: For swing trades
- 4H + 1H combo: For intraday setups
- 15M or below: Avoid, unless backtested deeply
Let’s say you’re checking GBP/JPY. Begin by scanning the Daily chart. If the price stays above the cloud and Span A keeps lifting above Span B, that means the pair is in a strong uptrend. That’s your bias. Now you drop to the 1H chart for precise entries.
Identify the Trend from the Cloud Structure
Your first scan on any chart is simple: where is the price sitting in relation to the cloud?
- Above the cloud → trend is bullish
- Below the cloud → trend is bearish
- Inside the cloud → market is uncertain, stay out
Also, you want Span A above Span B in bullish setups, and Span B above Span A in bearish. That tells you which side is stronger.
Wait for Entry Confirmation
Once the bigger trend aligns, you step down to the execution chart. For instance, from Daily to 4H or 1H.
Here’s where you look for a precise entry. You want a signal, not just bias. Some of the best triggers include:
- Tenkan crosses above Kijun (buy trigger)
- Tenkan crosses below Kijun (sell trigger)
- Candle closes above the cloud (bullish breakout)
- Chikou Span floats away from previous candles (trend confirmation)
For example, suppose on the 1H chart of EUR/USD, Tenkan crosses above Kijun, the candle breaks through the cloud, and Chikou clears past prices. That’s a stacked signal. You now have everything you need to enter confidently.
Plan Risk Before You Click Buy
Now, don’t jump in blindly. Every entry needs risk control.
Here’s how to set it up using Ichimoku itself:
- Stop loss below the Kijun-sen (in buys)
- Stop loss below the cloud base
- Take profit near prior swing high or cloud resistance (Span B)
For example, if you long AUD/USD at 0.6550 and the Kijun sits at 0.6520, set your stop below it, maybe at 0.6510. Then target 0.6620 as the next resistance near Span B. You lock in a clean 1:2 risk-reward.
Ride the Trend Using the Cloud Shape
Ichimoku gives you a visual cue on trend quality through the cloud slope.
- When Span A and B rise together, the trend is strong.
- When the cloud turns flat, it warns of range or slowdown.
Yes, you can trail your stop under the Kijun line or the cloud edge. As long as the slope holds, you stay in. If the Span A flattens or the candle pierces back into the cloud, tighten your stop or exit.
Learn to Stay Out Too
The power of Ichimoku isn’t just in entries. It shows you when to avoid traps.
Avoid entries when:
- Price floats inside the cloud
- Tenkan and Kijun twist around each other
- Chikou Span collides with past candles
- Cloud is tight, flat, or turning sideways
For example, GBP/USD on the 4H chart might look tempting. But if Chikou is stuck inside candles and price sits in the cloud, walk away. Clean setups always form outside noise.
Quick Checklist for Your Ichimoku Forex Strategy
- Higher timeframe trend confirms direction
- Price floats above or below the cloud (not inside)
- Span A and Span B align with the trend
- Tenkan-Kijun cross confirms momentum
- Chikou Span supports direction
- Stop loss below Kijun or cloud
- Target based on Span B or swing high/low
- No trades in cloud congestion or Chikou conflict
How Does Ichimoku Compare to Moving Averages?
| Feature | Ichimoku Kinko Hyo | Simple/Exponential Moving Averages |
| Trend Detection | Uses cloud structure and multiple lines to show direction | Uses slope of average line only |
| Momentum Signals | Tenkan-Kijun cross indicates momentum | Price crossing MA shows potential signal |
| Support/Resistance | Cloud (Kumo) acts as dynamic support/resistance | MA line acts as moving support/resistance |
| Forward Projection | Projects cloud 26 periods ahead | No forward projection |
| Confirmation Tool | Lagging Span (Chikou) confirms trend strength | No built-in confirmation element |
| Noise Filtering | Filters sideways movement using cloud width | Prone to false signals in choppy markets |
| Visual Complexity | Dense chart, steeper learning curve | Simpler and easier for beginners |
| Best Use Cases | Trend trading, swing trading on major FX pairs | Basic trend following or crossover systems |
How to Handle Ichimoku’s Limitations in Live Markets?
First of all, you need to accept that Ichimoku works best in trending markets. When price consolidates or reverses quickly, it may lag or give conflicting signals. Instead of treating it as a standalone solution, use it as a decision framework.
Here are common limitations you may face when using it in Forex along with smart ways to manage each one.
Cloud Signals Often Arrive Late
The Kumo (Cloud) looks ahead, but signal confirmation happens after the move begins. Many traders miss early opportunities because of this delay.
- Use RSI or MACD to catch early momentum.
- Enter on breakout candles and confirm direction using the Cloud.
- Place stops using Kijun or Senkou Span B for structure-based exits.
Too Much Screen Clutter
The chart shows five lines plus the shaded cloud. You may get overwhelmed, especially on lower timeframes.
- Hide Chikou Span unless you need trend validation.
- Focus only on Tenkan, Kijun, and the Cloud.
- Add a second clean chart for price action clarity if needed.
Default Settings Don’t Suit All Pairs
The original 9-26-52 parameters worked for the Japanese market rhythm. Forex pairs vary in volatility and behavior.
- Adjust to 10-30-60 on high-volatility pairs like GBP/JPY.
- Use backtesting to find best-fit values for your pair and timeframe.
- Stick to one modified setting per strategy to keep it consistent.
Range-Bound Price Creates Noise
When the market ranges, Ichimoku fails to provide direction. Price often floats inside the Cloud, creating signal confusion.
- Avoid trades when price stays between Senkou Span A and B.
- Wait for a full candle close outside the Cloud before entering.
- Monitor higher timeframes to confirm macro-trend before acting.
No Built-in Volume Indicator
Ichimoku doesn’t consider volume. As a result, it cannot confirm strength behind breakouts or reversals.
- Pair with OBV (On-Balance Volume) to validate breakout strength.
- Watch for large-bodied candles forming outside thin Clouds.
- Confirm breakout zones with volume spikes or range expansion.
Turn Knowledge into Profit
You've done the reading, now it's time to act. The best way to learn is by doing. Open a free, no-risk demo account and practice your strategy with virtual funds today.
Open a Free Demo AccountFinal Words
Ichimoku gives a full view of the market on one chart. You can see the trend, where price may go next, and where to enter or exit.
But make sure to use it in a way that respects structure. Follow the lines, wait for confirmation, and let the cloud guide your timing. That’s how you trade with clarity, not guesswork.