Sometimes, the market loses its momentum and prices just drift—bouncing between limits like a pendulum stuck in repetition. And that’s what makes it a range-bound market.
It happens because buyers and sellers reach a quiet balance. No side holds enough strength to break through. Volatility drops, patterns flatten, and decisions shift from chasing trends to respecting boundaries.
So, let’s discuss what exactly creates a range-bound market, how to identify it clearly, and what you need to trade it with precision.
While understanding Range-Bound Market is important, applying that knowledge is where the real growth happens. Create Your Free Forex Trading Account to practice with a free demo account and put your strategy to the test.
What is a Range-Bound Market?
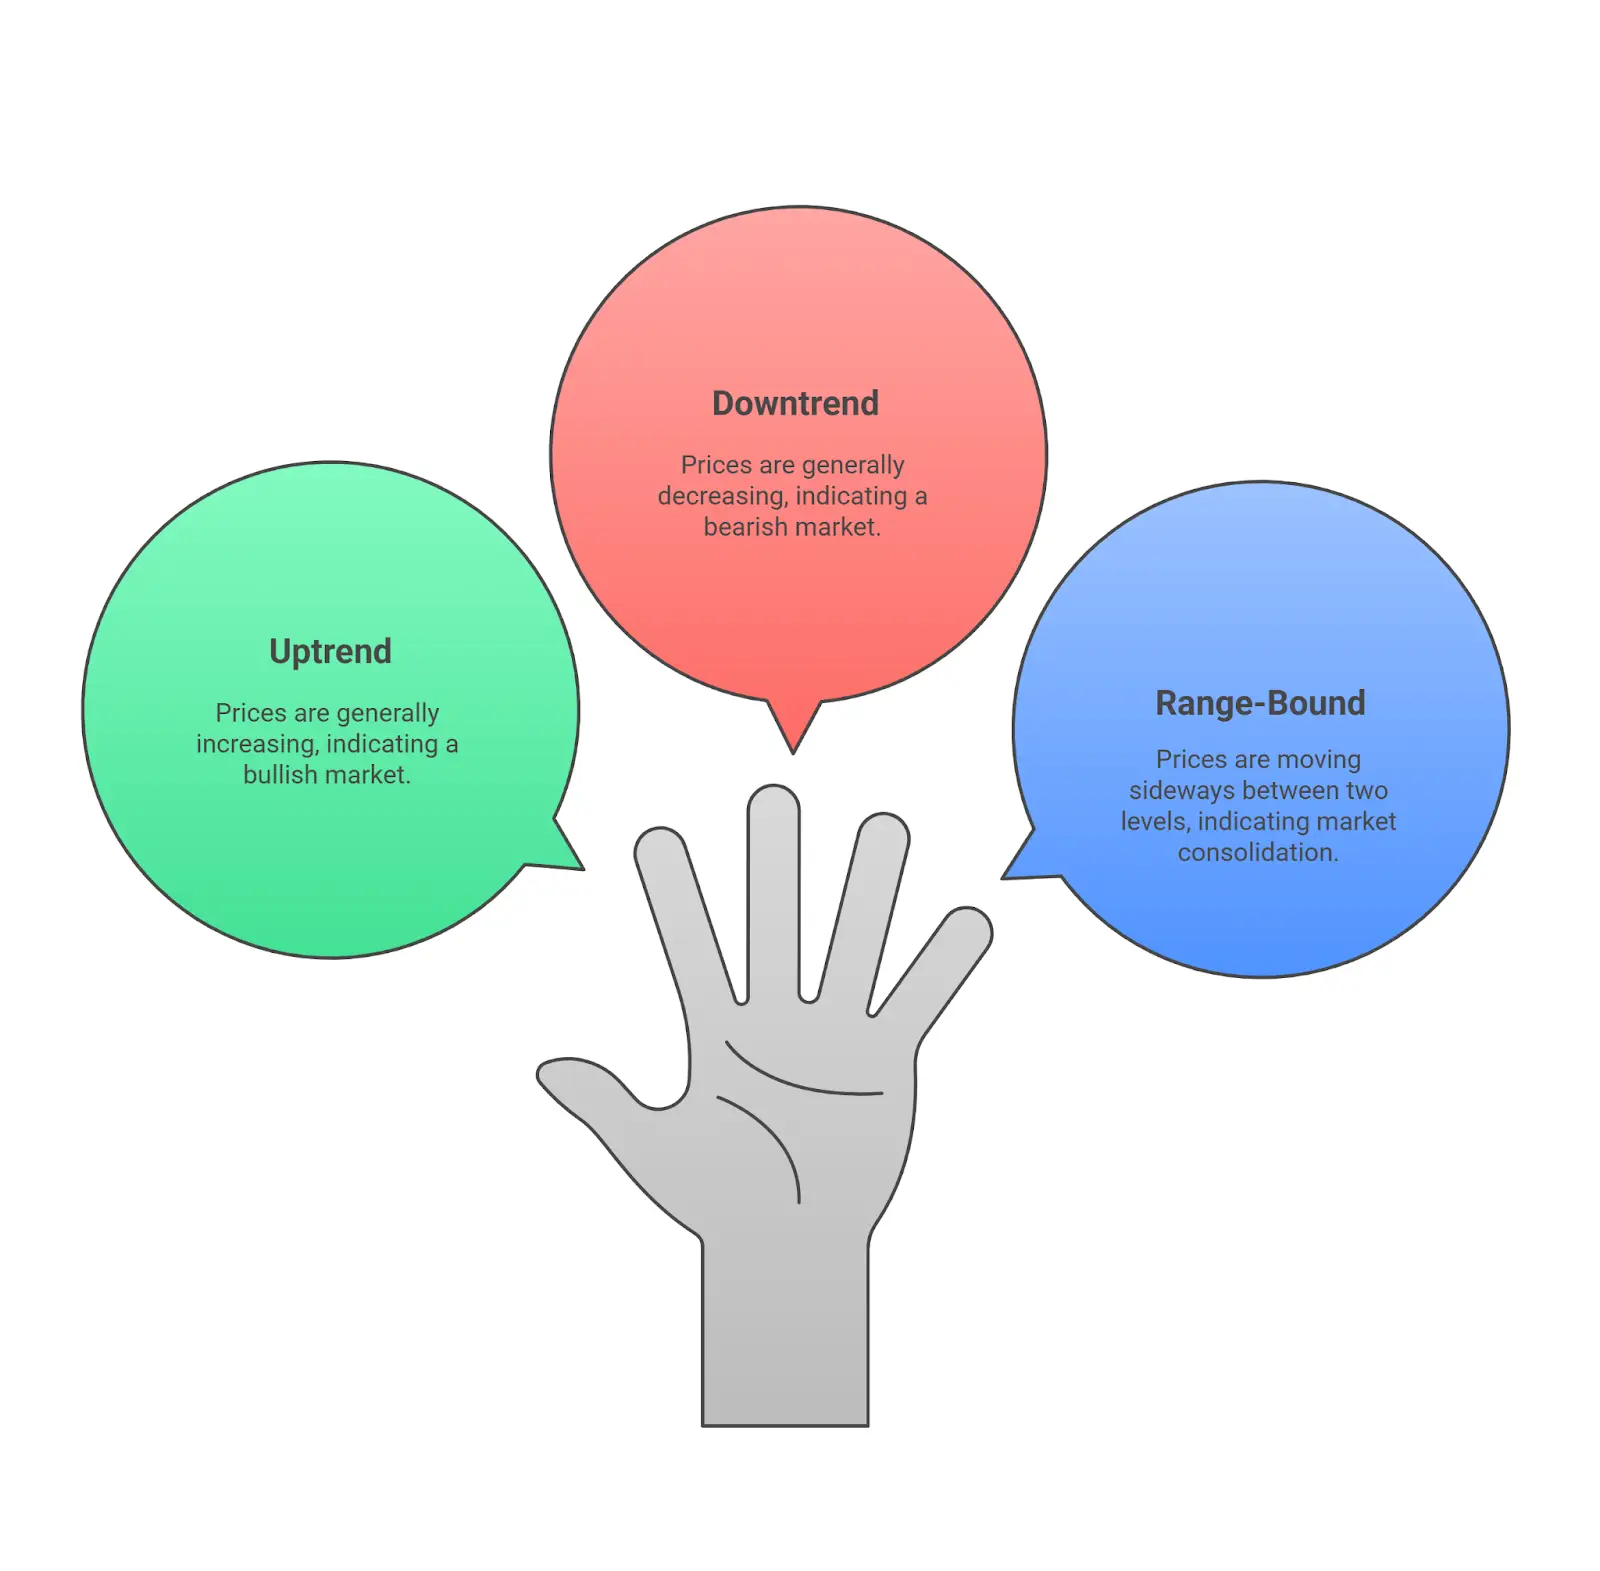
You must know that prices can do three things in trading: go up, go down, or move sideways. Right? So, a range-bound market happens when prices move sideways between two levels—like they’re stuck in a box.
Now, let’s suppose that:
- The top of the box is called resistance. That’s where the price keeps hitting a ceiling and falls back down.
- The bottom of the box is called support. That’s where the price finds a floor and bounces back up.
So, instead of trending upward or downward, the price just goes up and down inside that box. It might touch the top, drop back to the bottom, then go back up again—without breaking out. Traders often visualize this structure using a rectangle trading pattern that clearly maps the sideways range.
Why does this happen?
It usually means the market is undecided. Buyers and sellers are evenly matched. No one is strong enough to push the price out of the box. It stays “range-bound” until something big happens—like news, earnings, or a major event—that finally causes a breakout.
Why do traders care?
Because a range-bound market gives predictable patterns. A smart trader might:
- Buy near support (the bottom of the box)
- Sell near resistance (the top of the box)
It’s like bouncing a ball between two walls. You know where it’s likely to go next—unless it breaks through. Many traders even apply mean reversion in ranges as a systematic way to exploit these repetitive oscillations.
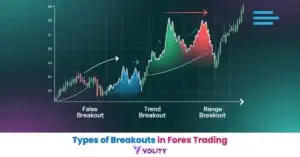
But here’s the catch: if price breaks the box, the pattern changes. That’s called a breakout. Until then, the market is “stuck in a range.”
Ready to Elevate Your Trading?
You have the information. Now, get the platform. Join thousands of successful traders who use Volity for its powerful tools, fast execution, and dedicated support.
Create Your Account in Under 3 MinutesRange-Bound vs Trending Market: Quick Comparison
| Aspect | Range-Bound Market | Trending Market |
| Price Movement | Moves within fixed support and resistance levels | Moves consistently upward or downward |
| Trend Direction | Lacks a clear directional trend | Follows a defined upward or downward path |
| Volatility | Lower and stable | Higher with sharp price changes |
| Strategy | Buy near support, sell near resistance | Follow trend using momentum strategies |
| Indicators Used | RSI, Bollinger Bands, Support/Resistance | MACD, Moving Averages, Trendlines |
| Volume | Relatively lower and stable | Increases with trend confirmation |
| Risk | More controlled due to confined movement | Can increase if trend reverses suddenly |
| Opportunity | Short-term gains from oscillations | Long-term gains from trend continuation |
How Does a Range-Bound Market Form?
A range-bound market forms when buyers and sellers enter a temporary balance. Neither side controls the price. So, the market moves sideways.
Let’s break it down:
- Buyers push the price up—but only to a point.
When the price hits a level where many traders are willing to sell, it stops rising. That level becomes the resistance.
- Sellers push the price down—but only so far.
When the price reaches a level where buyers start jumping in again, it stops falling. That level becomes the support.
- Back-and-forth repeats
The price bounces between support and resistance, which creates the range.
If you look closely, it may look like a tug-of-war that ends in a tie. The rope doesn’t move forward or backward. It just stays in the middle. That’s exactly what happens in a range-bound market. No clear winner. Only repeated moves within a zone.
How to Identify a Range-Bound Market
- Observe price bouncing between a horizontal support and resistance zone
- Check if moving averages (like 50-day and 200-day) stay flat and overlap
- Confirm RSI fluctuates between 30 and 70 without strong momentum
- Look for Bollinger Bands narrowing and hugging price
- Notice reduced trading volume across sessions
- Spot frequent reversals near key levels without clean breakouts
- Review economic news showing no strong directional bias
- Watch for failed breakouts returning quickly inside the range
How to Trade in Range-Bound Markets?
So here’s how you need to trade in a range-bound market—step by step.
First, open the chart and scan for a zone where price moves back and forth without breaking out. You’re looking for a flat, sideways movement. In fact, you’ll see candles rising toward a point and falling from it repeatedly, almost like a ball bouncing between two walls.
Then, look for clean levels. One level sits at the top—price touches it and turns back down. That’s your resistance. The bottom level is where price stops falling and turns upward. That’s your support. Both areas must be clear, tested more than once, and visible without zooming too far in.
Next, mark those zones. Draw a line at the highest point of the bounce and one at the lowest. You’ve now boxed the range. You’ll be working between those lines.
Now pause. Don’t rush in.
You need to wait for the price to approach one of the boundaries. Price hanging in the middle means unclear risk and poor reward. The real opportunity comes when price nears either support or resistance.
Once price reaches a boundary, start observing closely. Watch the candles. Are they stalling? Are wicks rejecting the level? Is volume changing? You’re looking for signs that buyers or sellers are stepping in. You don’t guess—you wait until the behavior confirms what side is likely to hold.
At this point, build your trade plan. Let’s say price hits support and forms a bullish engulfing pattern. That gives a signal. You can go long. Place your entry just above that confirming candle. Put your stop-loss slightly below support to account for minor price noise. Set your target near the resistance level above.
The same thing happens in reverse if price hits resistance. A bearish pattern? You plan for a short. Entry goes under the candle that confirms the rejection. Stop goes just above the resistance. Target moves down toward support.
In fact, some traders use indicators too—like RSI hovering around the mid-range or Bollinger Bands flattening out. But even without indicators, your price levels do the talking.
You’ll see it like this on a live chart: price touches support, stalls, shows a sharp wick upward, then a solid bullish candle follows. That’s where you act.
After entry, you monitor. Stay patient. Let the trade move naturally between levels. If price goes your way, trail the stop. If price stalls, reevaluate. If price blasts through the level, step back and wait. No need to chase.
Eventually, the price will break out of the range. When that happens, you don’t jump in immediately. You let the price pull back and test the breakout level. If it holds, you’ve got a new trend to work with.
Each move inside the range tells a story. You read it, react only at the right moments, and control your risk. That’s how you make the sideways market work in your favor.
Indicators That Work Well in Range-Bound Markets
| Indicator | Why Use It | When to Use | How to Use |
| Relative Strength Index (RSI) | Measures momentum to signal overbought or oversold zones. | During stable sideways price movement. | Look for RSI near 70 at resistance for sell, and near 30 at support for buy. |
| Stochastic Oscillator | Tracks closing price relative to range highs/lows. | When price oscillates clearly between fixed levels. | Readings above 80 suggest overbought; below 20 suggest oversold. |
| Bollinger Bands | Measures volatility and price stretch from the mean. | When bands appear narrow and horizontal. | Price touching upper band near resistance may reverse; lower band near support may bounce. |
| Moving Averages (Short & Long Term) | Smooths price to reveal direction and entry zones. | When price consolidates and no trend emerges. | Flat 50-day and 200-day moving averages confirm a range. |
| MACD (Moving Average Convergence Divergence) | Tracks momentum shifts and crossover signals. | Effective in low-volatility, flat markets. | MACD crosses above signal line near support = buy; below near resistance = sell. |
| Volume Oscillator | Measures volume momentum to confirm breakouts or rejections. | Around key support/resistance interactions. | Volume spikes near range edges suggest breakouts; drop indicates rejection. |
| Average True Range (ATR) | Detects volatility levels to avoid false setups. | Before entering any trade inside a range. | Falling ATR confirms tightening range; rising ATR at edge hints breakout. |
| Commodity Channel Index (CCI) | Measures price deviation from its average. | In markets with repetitive support-resistance interactions. | CCI > +100 at resistance = reversal; < -100 at support = bounce. |
| Donchian Channels | Highlights highest high and lowest low over a period. | When price stays confined to repetitive highs and lows. | Acts like dynamic support/resistance; entries align with bounces. |
| Price Action with Candlestick Patterns | Gives raw visual cues of exhaustion or continuation. | Near key range edges. | Look for hammers, dojis, engulfing candles at support/resistance zones. |
When Do Range-Bound Markets End?
A range-bound market doesn’t last forever. At some point, price breaks out and transitions into a trend—this is where understanding the range vs trending market distinction becomes essential. A breakout marks the shift from sideways indecision to directional momentum.
You’ll see it when:
- Price closes beyond the range with large candles
- Volume spikes near the breakout point
- Indicators shift from neutral to directional (e.g., RSI crosses 70 or 30)
- Price retests the broken level and holds in the new zone
That’s exactly when the sideways rhythm breaks—and a trend begins.
Turn Knowledge into Profit
You've done the reading, now it's time to act. The best way to learn is by doing. Open a free, no-risk demo account and practice your strategy with virtual funds today.
Open a Free Demo AccountFinal Words
A range-bound market rewards discipline over speed. You need patience, structure, and clear rules. Focus on support and resistance. Monitor volume as it touches those levels. Use indicators that read momentum without trend bias.
Precision becomes your edge when price stays boxed in. So, map the range, wait for setups, and stay ready—because one shift in pressure can end the range and open a new path.