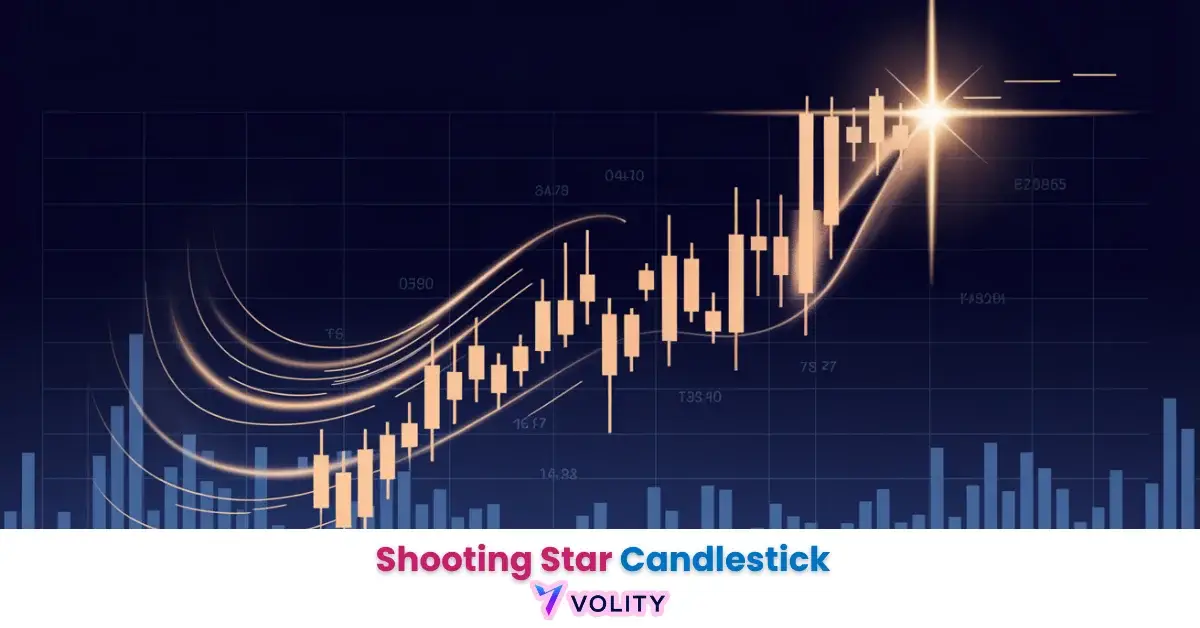
A Shooting Star candlestick is a bearish reversal pattern that forms after an uptrend. It has a small real body near the session’s low, a long upper wick at least twice the size of the body, and little or no lower wick. The pattern signals buyer exhaustion, and the reversal strengthens when the next candle closes below the Shooting Star’s low, ideally on higher trading volume.
This guide will cover its success rate, how to confirm the signal, and actionable trading strategies.
What Is a Shooting Star Candlestick?
A shooting star is a candlestick with a small real body, little to no lower wick, and a long upper wick. It signals that during the trading session, buyers initially pushed the price significantly higher, but sellers took control and forced the price back down to close near the open.
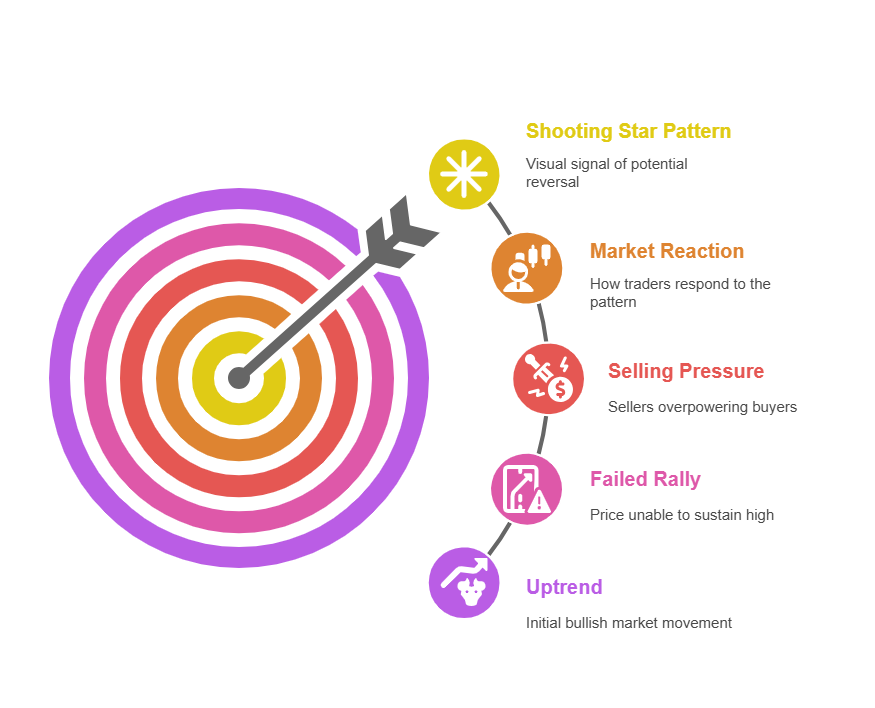
This price action represents a failed rally and a potential shift in momentum from bullish to bearish. The key rules for a valid shooting star are:
- The long upper wick (or shadow) must be at least two times the length of the candle body.
- It must appear at the top of an uptrend, often near a resistance level.
Reliability & Statistics
The shooting star pattern is a common signal, but its standalone reliability is moderate. According to extensive research by Thomas Bulkowski, a leading authority on chart patterns, the shooting star has a bearish reversal probability of 59%.
This statistic suggests the pattern is only slightly better than a coin flip and highlights why confirmation is absolutely necessary. Bulkowski’s historical data also shows the pattern performs better in bear markets and has a higher success rate when the subsequent 10-day decline is significant. Relying on this pattern alone is a low-probability strategy.
What Are the Key Features of a True Shooting Star?
To avoid false signals, a candlestick must meet specific criteria to be considered a true shooting star. Use this checklist for accurate identification.
- Shape Rule #1: The upper shadow must be at least twice the size of the candle body.
- Shape Rule #2: The real body should be small and located at or near the low of the session range.
- Shape Rule #3: There should be little to no lower shadow.
- Trend Context: The pattern must appear after a clear uptrend.
Numeric OHLC Example: Imagine a stock is in an uptrend. In one session, it has the following prices:
- Open: $102
- High: $108
- Low: $101
- Close: $103 This would form a shooting star because the upper wick ($108 – $103 = $5) is much longer than the body ($103 – $102 = $1), and the body is near the session low.
How to Spot and Confirm a Shooting Star Before Acting?
Here’s how to spot and confirm a Shooting Star pattern before making any trading decision. The process involves careful observation, not rushing into the trade immediately.
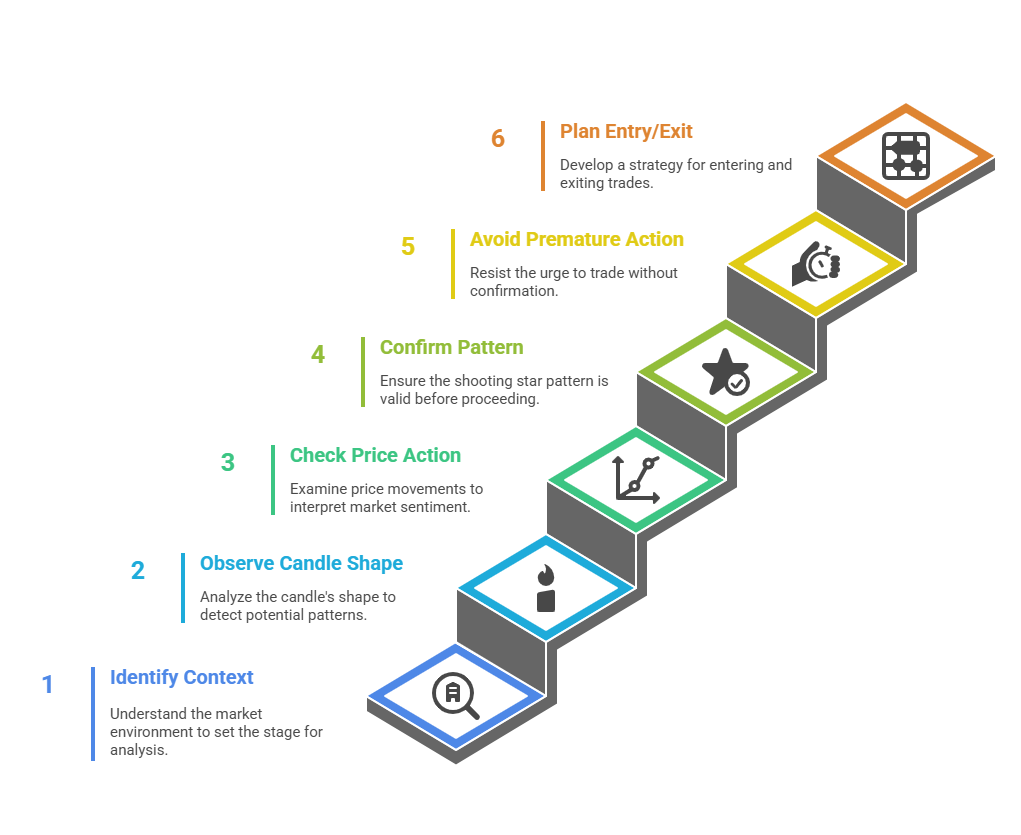
1. Identify the Context First
You need to look at the current trend. A Shooting Star only carries meaning at the top of an uptrend. The pattern must form after a series of bullish candles. The market needs to show strong upward momentum before the pattern appears.
2. Observe the Candle’s Shape
It is important for you watch for the specific structure of the Shooting Star:
- Small real body near the session’s low
- Long upper shadow at least twice the body length
- Very small or no lower shadow
A clear upper wick signals failed buying pressure. The sellers forced the price down near the open by the close of the session.
3. Check the Price Action Story
You need to picture the sequence:
- Buyers push the price up quickly after the open
- Sellers overwhelm the buyers at the peak
- Price returns near the opening level, leaving a long upper wick
This is to help you check if the bulls have lost control and bears are gaining strength.
Step 4: Confirm the Shooting Star Pattern Before Trading
| Confirmation Method | What To Look For |
| Next Candle Close | A bearish candle closing below the Shooting Star’s low strengthens the reversal signal. |
| Volume Spike | High trading volume during the Shooting Star session indicates serious selling pressure. |
| Resistance Level | Pattern forms near a known resistance level or psychological price barrier. |
| Technical Indicators | RSI divergence, Stochastic crossover, or MACD bearish crossover increase confidence. |
5. Avoid Acting Without Confirmation
See, if you act immediately after spotting the Shooting Star, it may increase the risk. You need to confirm the pattern protects against market noise. So, wait for:
- A lower close in the next session
- Supporting signals from technical analysis
6. Mark Your Entry and Exit Plan
After confirmation, what you need to do is:
- Set a sell order below the Shooting Star’s low
- Place a stop-loss above the Shooting Star’s high
- Decide the profit target based on nearby support levels or Fibonacci retracement points
Does the Color of a Shooting Star Matter?
Yes, a red (bearish) shooting star is a stronger bearish signal than a green one. A red body indicates that sellers not only rejected the higher prices but also successfully pushed the closing price below the opening price. This shows greater seller control.
A green shooting star is still a valid bearish pattern. It requires stricter confirmation because buyers still managed to achieve a positive close for the session, showing some resilience.
Red vs Green Shooting Star
| Feature | Red Shooting Star | Green Shooting Star |
| Pattern Details | The candlestick opens higher, moves significantly up, but closes below the opening price, forming a small red body. | The candlestick opens higher, moves significantly up, but closes slightly above the opening price, forming a small green body. |
| Upper Shadow (Wick) | Long upper shadow, at least twice the size of the body. Indicates a strong rejection of higher prices. | Long upper shadow, at least twice the size of the body. Also signals rejection of higher prices, but less aggressively. |
| Lower Shadow (Wick) | Very small or no lower shadow, indicating minimal buying support near the close. | Very small or no lower shadow, indicating similar price action to the red version. |
| Closing Price | Closes below the opening price, resulting in a red body. | Closes slightly above the opening price, resulting in a green body. |
| Market Sentiment Indication | Signals a strong potential bearish reversal. Sellers completely erased gains and pushed the price below the open. | Signals a bearish reversal but suggests that buyers retained minor control by keeping the close above the open. |
| Reliability of Signal | Considered a stronger bearish signal due to the close below the opening price. | Considered a weaker bearish signal compared to the red version, but still indicates selling pressure. |
| Usage in Trading | Traders may take immediate action when confirmed by volume or other indicators. High priority for short positions. | Traders may wait for additional confirmation before acting. Often combined with other signals for caution. |
Shooting Star vs Similar Candlestick Patterns
The shooting star is often confused with other patterns that have a similar shape. The key differentiator is always the trend context.
| Pattern | Shape | Trend Context | Signal |
| Shooting Star | Small body, long upper wick | Uptrend | Bearish Reversal |
| Inverted Hammer | Small body, long upper wick | Downtrend | Bullish Reversal |
| Gravestone Doji | No body, long upper wick | Uptrend or Downtrend | Reversal (stronger) |
| Hanging Man | Small body, long lower wick | Uptrend | Bearish Reversal |
Does the Shooting Star’s Reliability Change Across Markets?
The shooting star’s reliability can vary across different asset classes due to their unique characteristics.
- Forex: In the 24/5 forex market, shooting stars are common but can be triggered by news-driven volatility. Confirmation is crucial to avoid false signals during low-liquidity sessions.
- Stocks: In equities, shooting stars are powerful signals, especially if they form with a price gap up before reversing, often around earnings reports.
- Cryptocurrency: The crypto market’s high volatility can create significant wick noise. Traders often use an ATR filter (Average True Range) to validate that the wick’s length is statistically significant before trusting the pattern.
How Do You Trade the Shooting Star Pattern?
A structured trading plan is essential for executing a shooting star setup.
- Entry Trigger:
- Aggressive: Enter a short position near the close of the shooting star candle.
- Conservative: Wait for the next candle to close below the low of the shooting star before entering.
- Stop-Loss: Place the stop-loss a few pips or cents above the high of the shooting star’s wick. Some traders add an ATR buffer for extra protection.
- Profit Targets:
- Set the first target at the nearest major support zone.
- Use Fibonacci retracement levels of the prior uptrend as subsequent targets.
- Position Sizing: Calculate your position size based on your stop-loss distance and a predefined account risk (e.g., 1% of your capital per trade).
Common Mistakes Traders Make
Many traders lose money on this pattern by making avoidable errors.
- Ignoring confirmation from the next candlestick before entering the trade.
- Trading the pattern in sideways or range-bound markets where no clear trend exists.
- Placing trades without checking for strong resistance zones near the pattern.
- Overlooking volume analysis, missing clues about market strength.
- Using the pattern alone without combining it with technical indicators.
- Setting stop-loss levels too tight, causing premature trade exits.
- Assuming every shooting star guarantees a trend reversal.
- Failing to check the broader market sentiment or news events.
- Confusing the shooting star with similar patterns like the inverted hammer.
- Neglecting proper risk-reward calculations before taking the position.
Combining Shooting Star with Other Indicators
Combining the shooting star with other technical indicators creates a powerful, high-probability trading system.
- RSI: A shooting star that forms while the RSI is overbought (>70) and showing bearish divergence is a very strong reversal signal.
- Moving Averages: A shooting star that rejects a key moving average, like the 200-day SMA, acts as a strong confirmation of resistance.
- Fibonacci & Volume: A shooting star forming at a key Fibonacci resistance level (e.g., 61.8%) on a volume spike is a classic A+ setup.
How Do Algorithms Identify a Shooting Star?
Algorithms identify a shooting star using a pre-defined set of mathematical rules based on OHLC data. This logic can be coded in platforms like TradingView’s Pine Script or MetaTrader’s MQL.
The basic code rules are:
- Verify an existing uptrend is in place.
- Check that the upper wick (High – Close) or (High – Open) is at least two times the body size.
- Confirm the real body (Close – Open) is small.
- Ensure the lower wick (Open – Low) or (Close – Low) is minimal.
Risk Management & Strategy Integration
The shooting star is a signal, not a complete trading plan. It should be integrated into a broader strategy that includes strict risk management rules.
- Never risk more than a small percentage (e.g., 1-2%) of your account on a single trade.
- Use a trade journal to track your setups and their performance.
- Think in terms of R-multiples (risk/reward ratio) to ensure your winning trades are significantly larger than your losing trades.
Final Thoughts
The shooting star candlestick is a valuable tool for identifying potential market tops. It serves as an early warning that an uptrend is weakening, but it is not a guarantee of a reversal. The key to successfully trading this pattern lies in combining it with context and confirmation. When validated by other signals, the shooting star can be a highly reliable component of any trader’s candlestick analysis toolkit.