Réponse rapide
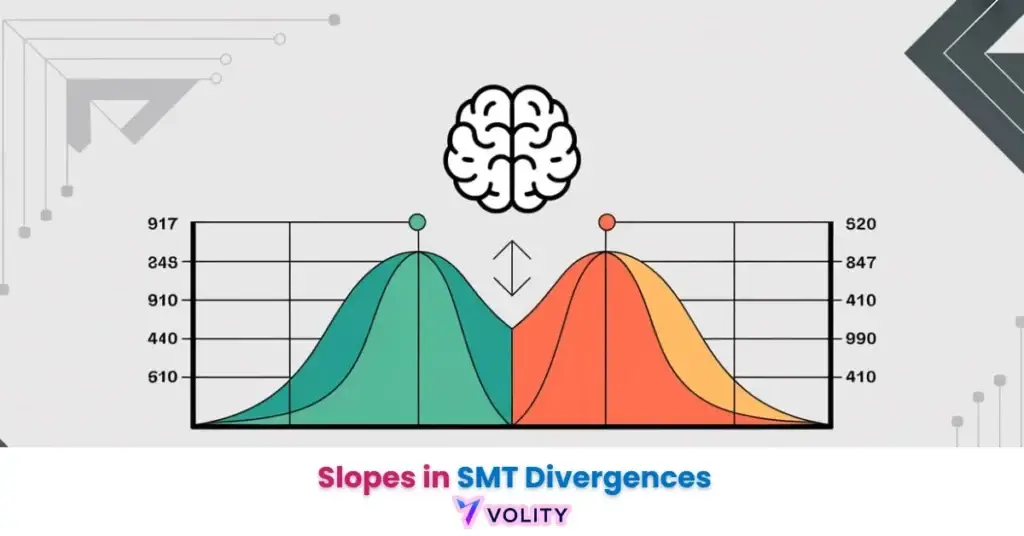
Les pentes dans les divergences SMT (Smart Money Technique) comparent l’angle des mouvements de prix entre deux actifs corrélés pour détecter quand l’argent intelligent se positionne à contre-courant de la foule. Quand un actif fait un sommet plus haut alors qu’un actif corrélé ne le fait pas, les pentes divergentes peuvent signaler un retournement. C’est un outil de confirmation avancé, pas un signal autonome.
Les signaux de divergence SMT reposent sur une forte corrélation des actifs (0,85+) qui peut se détériorer rapidement lors d’événements de volatilité macroéconomique, rendant le signal invalide en quelques minutes. De fausses configurations SMT se forment pendant les zones mortes de faible liquidité, lorsque l’élargissement des spreads crée un désaccord de prix artificiel entre des paires corrélées, piégeant les traders avant des retournements explosifs. L’interprétation de l’angle de la pente est subjective ; les traders qui ne sont pas d’accord sur le fait qu’un mouvement est raide ou plat sortent souvent à des niveaux de prix différents, ce qui cause de la frustration. Les résultats obtenus pendant les chevauchements Londres-New York supposent un slippage minimal et une exécution de niveau professionnel ; les traders de détail avec des spreads plus larges et des exécutions plus lentes constatent des taux de gain nettement inférieurs. Une dépendance excessive à la divergence SMT sans confirmation par le volume génère des faux signaux lors de périodes de marché agitées et à faible conviction. Les performances passées ne préjugent pas des résultats futurs. Capital à risque.
La divergence SMT (Smart Money Technique) est un outil avancé de comparaison multi-actifs qui identifie les déséquilibres du marché entre des instruments hautement corrélés comme EUR/USD et GBP/USD. En 2026, la pente de ces mouvements de prix, mesurant l’angle de déplacement entre deux pivots, est devenue le filtre principal pour distinguer l’accumulation institutionnelle du bruit de détail. Particulièrement efficace pendant les chevauchements des sessions de Londres et de New York, l’analyse de la pente SMT permet aux traders professionnels de détecter les points de retournement structurels avant qu’ils ne se manifestent sur les graphiques individuels.
Les mécanismes de la divergence SMT fonctionnent comme un détecteur de mensonge pour la symétrie des prix, identifiant le moment où deux instruments corrélés ne parviennent pas à confirmer leurs sommets ou creux structurels respectifs. Ce processus permet aux traders d’observer le moment exact où la Smart Money est active sur un actif alors que la masse des traders de détail reste piégée sur un autre. Cela demeure la lecture multi-actifs à plus haute conviction sur le marché quotidien du forex de 9,6 billions de dollars.
Le paysage commercial de 2026 est défini par des balayages de liquidité à haute fréquence qui créent souvent de faux signaux sur les graphiques individuels. Maîtriser la relation de pente SMT nécessite une approche disciplinée de la corrélation des actifs, du timing des sessions et de la validation du flux d’ordres institutionnels.
Comprendre Forex est important, mais la vraie progression commence en appliquant ces connaissances. Créez votre compte de trading forex gratuit pour vous entraîner sur un compte démo gratuit et mettre votre stratégie à l’épreuve.
Qu’est-ce que la divergence SMT et comment les pentes la confirment-elles en 2026 ?
La divergence SMT est un signal technique multi-actifs qui identifie un déséquilibre dans la livraison des prix entre deux instruments financiers hautement corrélés. Le signal se forme lorsqu’un instrument crée un nouvel extrême, soit un sommet ou un creux, tandis que sa paire corrélée ne parvient pas à suivre avec un extrême correspondant.
- Définition de la corrélation des actifs : Comparer EUR/USD vs GBP/USD ou ES vs NQ signifie analyser des paires ou des indices qui évoluent historiquement de concert, en maintenant des coefficients de corrélation supérieurs à 0,85
- Le décalage : Une paire atteint un nouveau sommet/creux tandis que l’autre échoue, créant une divergence structurelle qui révèle un positionnement institutionnel caché
- Mise à jour 2026 : L’analyse de la pente est devenue la deuxième étape obligatoire pour la validation du signal, car le désaccord visuel des prix seul génère trop de faux signaux
Les configurations de divergence SMT se tradent surtout pendant le chevauchement Londres-New York, lorsque la liquidité est la plus forte. Ce taux de gain élevé reflète le regroupement institutionnel pendant les heures de liquidité maximale, lorsque les bureaux de change des grandes banques exécutent leur positionnement stratégique simultanément.
Prêt à faire passer votre trading au niveau supérieur ?
Vous avez les connaissances. Il vous manque la plateforme. Rejoignez des milliers de traders qui choisissent Volity pour ses outils puissants, son exécution rapide et son support dédié.
Créez votre compte en moins de 3 minutesComment identifier une pente « leader » par rapport à une pente « lagger » dans les configurations SMT ?
La pente leader identifie l’actif spécifique qui brise la structure du marché ou balaie la liquidité avant sa contrepartie corrélée. Cette domination directionnelle révèle quel participant au marché, haussier ou baissier, détient une réelle conviction dans le mouvement.
Les caractéristiques du leader affichent des cassures nettes des niveaux structurels antérieurs, un déplacement de prix raide qui couvre une distance significative rapidement, et une expansion visible du volume qui confirme la participation institutionnelle. Les caractéristiques du lagger montrent un mouvement plus plat, un échec visible à briser le pivot précédent avec autorité, et une hésitation qui suggère que les traders de détail ne savent pas s’ils doivent suivre la direction du leader. L’application commerciale consiste à suivre l’intention du leader mais à exécuter sur le déséquilibre du lagger ; une fois que le leader s’engage mais que le lagger ne parvient pas à confirmer, la rupture structurelle crée un contre-mouvement à haute probabilité.
Une grande partie du volume institutionnel est désormais pilotée par des algorithmes de test de liquidité qui créent les pentes asymétriques exploitées par les traders SMT. Ces algorithmes poussent délibérément un actif corrélé en avant tout en retenant l’autre, à la recherche de grappes de stop-loss et de zones de liquidité.
Indicateurs techniques pour le trading : les cadres intègrent des outils de mesure de pente qui automatisent l’identification leader/lagger plutôt que de nécessiter une évaluation visuelle manuelle.
Utilisez un indicateur de corrélation mobile sur 60 jours pour vérifier vos paires SMT en 2026 ; les signaux haute fidélité nécessitent un coefficient de corrélation supérieur à 0,85. Si les paires commencent à évoluer indépendamment (décorrélation), le signal SMT devient un bruit statistiquement peu fiable.
Quelle est la fiabilité de la divergence SMT entre EUR/USD et GBP/USD ?
EUR/USD et GBP/USD forment la paire SMT à la plus haute fidélité, en particulier aux extrêmes structurels. Ces deux instruments partagent la corrélation historique la plus profonde parmi toutes les paires forex en raison de leur intégration économique européenne partagée et de profils de volatilité similaires.
La règle de corrélation de 0,85 explique pourquoi ces paires fonctionnent comme l’étalon-or pour la lecture SMT ; lorsqu’elles divergent, le désaccord porte une signification structurelle maximale plutôt qu’un bruit aléatoire. Le timing de la session détermine les pics de fidélité SMT pendant la poussée de liquidité de 8h00 à 11h00 EST, lorsque les flux institutionnels européens et américains se chevauchent, créant l’action de prix la plus transparente. Les benchmarks de 2026 montrent un facteur de profit moyen de 2,4+ rapporté par les bureaux systématiques utilisant des filtres SMT, ce qui signifie que chaque dollar risqué génère 2,40 $ de rendement en moyenne sur plusieurs transactions.
EUR/USD a balayé un sommet précédent à 1,0950 tandis que GBP/USD n’a pas réussi à briser 1,2700, créant une divergence SMT baissière où le leader (faiblesse du GBP) a précédé le mouvement plus large. Les deux paires se sont inversées, GBP/USD menant le déclin de 60 pips en 4 heures, produisant un gain SMT net (FundYourFX SMT Correlation Research). Les performances passées ne préjugent pas des résultats futurs. Cet exemple démontre comment l’échec du lagger à confirmer la cassure du leader prédit le retournement avec une haute certitude statistique.
Comment les pentes raides vs plates révèlent-elles l’accumulation institutionnelle ?
L’analyse du déplacement de la pente identifie l’angle spécifique du mouvement des prix qui distingue l’accumulation institutionnelle du flux émotionnel de détail. Le degré de l’angle, mesuré en degrés à partir d’une ligne de base horizontale, révèle l’urgence et la conviction derrière le mouvement des prix.
| Type de pente | Angle de l’action des prix | Intention institutionnelle |
| Raide vers le bas | > 60 degrés | Balayage de liquidité (Piège) |
| Plat vers le bas | < 30 degrés | Accumulation (Construction) |
| Raide vers le haut | > 60 degrés | Expansion de momentum |
| Plat vers le haut | < 30 degrés | Distribution (Sortie) |
| Plat | 0 degré | Impasse (Indécision) |
Source : analyse Flux Charts 2026.
Les pentes raides vers le bas dépassant 60 degrés indiquent des balayages de liquidité agressifs où les algorithmes institutionnels forcent le prix à la baisse pour déclencher les stops des traders de détail avant de se retourner ; cette vélocité signale un piège plutôt qu’une vente réelle. Les pentes plates vers le bas en dessous de 30 degrés révèlent une accumulation institutionnelle patiente où la smart money construit tranquillement des positions sans déclencher de cascades de stops (Flux Charts 2026 SMT Slope Analysis). Les pentes raides vers le haut signalent une expansion de momentum où le prix accélère vers de nouveaux sommets avec un soutien institutionnel, tandis que les pentes plates vers le haut précèdent souvent une distribution où les institutions sortent tranquillement de leurs positions avant que le prix ne stagne.
WARNING: Évitez de trader les divergences SMT qui se forment pendant les zones mortes de faible liquidité entre les sessions ; les données de 2026 montrent que les mèches asymétriques imprimées pendant ces heures sont souvent le résultat d’un élargissement des spreads plutôt que d’une intention institutionnelle.
Dois-je utiliser le RSI ou le MACD pour valider les divergences de pente SMT ?
Les indicateurs de confluence identifient le changement de momentum sous-jacent qui soutient le désaccord visuel des prix observé dans l’analyse de la pente SMT. Le RSI et le MACD fournissent une validation critique que le mouvement du leader reflète un véritable momentum plutôt qu’une pointe temporaire.
L’épuisement du RSI aux extrêmes de 70 ou 30 confirme que la pente du leader est devenue surétendue et vulnérable au retournement, fournissant des signaux d’entrée à haute conviction lorsqu’ils sont combinés avec l’échec du lagger à confirmer. La convergence MACD identifie le moment où le momentum du lagger commence à s’aligner avec celui du leader, signalant que la divergence se résout alors que les deux actifs se préparent à bouger à nouveau en synchronie. Le consensus de 2026 parmi les principaux bureaux institutionnels privilégie l’analyse du profil de volume par rapport aux oscillateurs de base pour la validation SMT ; les traders examinent où se regroupent les blocs d’ordres institutionnels et si le signal SMT confirme ou contredit les extrêmes des blocs d’ordres.
Comment définir un stop loss : le placement devient critique lors de la validation des pentes SMT avec la confluence des indicateurs ; les stops doivent être placés juste au-delà du point de déplacement extrême du leader pour se protéger contre les faux signaux tout en respectant la structure du signal.
💡 KEY INSIGHT: Le changement d’état de livraison (CISD) est la confirmation ultime de la pente ; une fois qu’une divergence SMT se forme, attendre que la paire leader récupère un bloc d’ordres institutionnel ou un Fair Value Gap rend le signal nettement plus fiable.
Transformez vos connaissances en profit
Vous avez lu, il est temps d’agir. La meilleure façon d’apprendre, c’est en pratiquant. Ouvrez un compte démo gratuit et sans risque et entraînez votre stratégie avec des fonds virtuels dès aujourd’hui.
Ouvrir un compte démo gratuitMeilleurs actifs corrélés pour l’analyse de la pente SMT en 2026
L’analyse inter-marchés identifie les grappes d’actifs spécifiques, y compris les indices boursiers et les métaux précieux, où la divergence de la pente SMT est la plus prédictive. Le marché de 2026 s’est étendu au-delà des corrélations traditionnelles des paires forex pour inclure des relations inter-actifs qui révèlent un positionnement macroéconomique caché.
Les corrélations des indices boursiers entre S&P 500 (ES) vs Nasdaq 100 (NQ) vs Dow 30 (YM) fonctionnent de manière similaire à l’analyse forex EUR/GBP ; lorsque les actions technologiques (NQ) divergent de la force globale du marché (ES), le désaccord signale une réallocation institutionnelle. Les relations entre les métaux, entre l’or (XAU) et l’argent (XAG), révèlent si la demande de métaux précieux est motivée par la peur de l’inflation (les deux augmentant ensemble) ou par une fuite vers la sécurité (l’or menant, l’argent à la traîne). L’indice du dollar (DXY) sert de filtre maître pour tous les signaux SMT appariés au USD ; lorsque le DXY diverge de USD/JPY ou USD/CHF, cela signale que la force de la devise est motivée par l’appétit pour le risque plutôt que par une pure domination du dollar.
Trading Forex pour débutants : les cadres intègrent l’analyse SMT multi-actifs une fois que les traders maîtrisent l’identification sur une seule paire. Les régimes de volatilité du marché déterminent quels groupes d’actifs maintiennent une corrélation étroite ; pendant une volatilité extrême, les corrélations se compriment ou s’inversent, rendant les signaux SMT peu fiables jusqu’à ce que les relations normales soient rétablies.
Points clés
- La divergence SMT est un signal technique multi-actifs identifiant les déséquilibres de livraison des prix entre des instruments hautement corrélés.
- Le déplacement de la pente mesure l’angle du mouvement des prix pour distinguer l’intention institutionnelle de la panique ou de la cupidité des traders de détail.
- EUR/USD vs GBP/USD reste la paire SMT à la plus haute fidélité, en particulier aux extrêmes structurels majeurs.
- L’alignement des sessions est critique, car les signaux SMT atteignent une fiabilité maximale pendant les chevauchements de liquidité de Londres et de New York.
- L’analyse leader vs lagger identifie quel actif initie la cassure structurelle et lequel révèle l’hésitation cachée du marché.
- La confirmation du volume sur la pente du leader est obligatoire pour les configurations de niveau institutionnel, assurant la participation des grandes banques au mouvement.
Foire aux questions
Cet article contient des références aux pentes dans les divergences SMT, à la technique Smart Money et à Volity, une plateforme de trading de CFD réglementée. Ce contenu est produit à des fins éducatives uniquement et ne constitue pas un conseil financier ou une recommandation d’achat ou de vente d’un instrument financier. Vérifiez toujours le statut réglementaire actuel et les détails de la plateforme avant d’utiliser un service de trading. Certains liens dans cet article peuvent être des liens d’affiliation.