Quick answer
Natural gas trading speculates on the price of natural gas, usually through CFDs or futures with leverage, going long or short. Gas is one of the most volatile commodities, driven by weather, storage levels, season and supply. That volatility creates big opportunities and big risks, so natural gas traders rely heavily on stops and careful position sizing.
Natural gas trading speculates on the price of US Henry Hub gas, the global benchmark for natural gas pricing. Volity offers Henry Hub CFDs with leverage up to 1:100, no expiry, and CySEC-regulated execution. Natural gas is one of the most volatile retail-tradable commodity trading platform, with predictable weekly EIA storage reports driving short-term moves.
Henry Hub: the benchmark
Henry Hub is a natural gas pipeline interconnect in Erath, Louisiana. It serves as the delivery point for NYMEX natural gas futures and is the standard benchmark for North American gas pricing.
- Standard futures contract (NG on NYMEX): 10,000 MMBtu
- Tick size: $0.0001/MMBtu ($1 per tick per contract)
- Volity CFD trading platform contract: flexible (0.01 lot minimum = 100 MMBtu)
- Volity leverage: up to 1:100
- Trading hours (Volity CFD): Sunday 23:00 GMT to Friday 22:00 GMT
European TTF gas and Asian JKM LNG prices are separate benchmarks. Volity’s natural gas CFD references Henry Hub.
Why natural gas is uniquely volatile
Three structural reasons natural gas moves more than crude oil trading:
1. Inelastic short-term demand. Heating and power generation demand is largely set by weather. People do not stop heating their homes when prices rise; they pay more. Demand cannot respond quickly to price.
2. Storage cycle dependence. US natural gas storage builds during summer (low heating demand) and draws during winter. The weekly EIA storage report reveals whether the cycle is on track. Surprises drive 5-10% moves.
3. Weather-driven catalysts. Polar vortex events, hot summers (electricity for AC), and hurricane disruptions to Gulf Coast production all move natural gas prices sharply.
The result: natural gas can move 3-8% in a single trading day, more than typical crude moves. This is opportunity and risk equally.
The weekly EIA storage report
Every Thursday at 10:30 EST, the US Energy Information Administration publishes the Weekly Natural Gas Storage Report. The report tells you:
- Total US natural gas in underground storage
- Change from the previous week (build or draw)
- Comparison to the 5-year average
Market reaction:
- Larger-than-expected draw (winter) / smaller-than-expected build (summer): bullish
- Smaller-than-expected draw / larger-than-expected build: bearish
The 30-minute window after release routinely sees natural gas move 2-4%. This is the most predictable retail-tradable catalyst for natural gas.
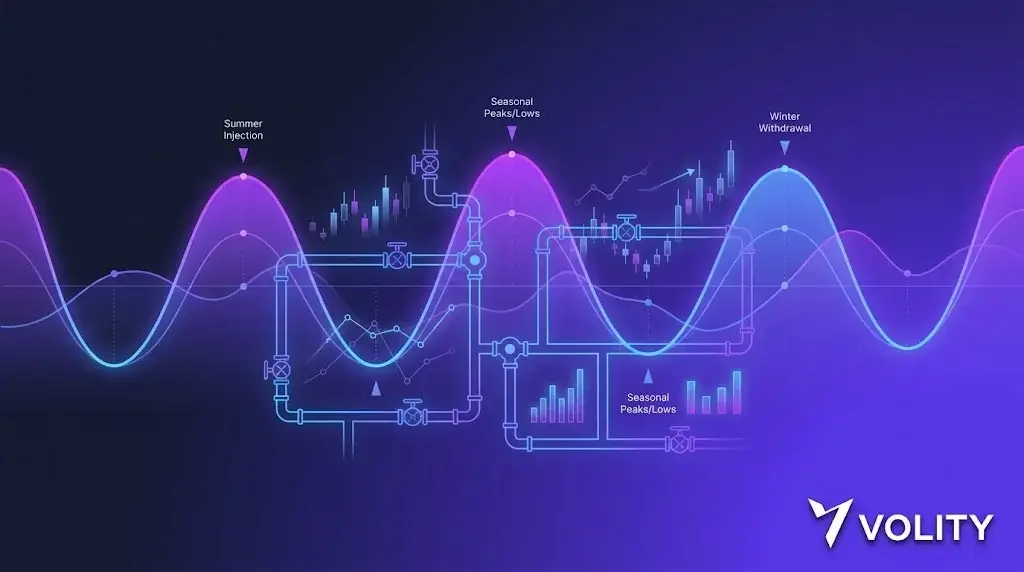
Seasonality patterns
| Season | Storage cycle | Price tendency |
|---|---|---|
| Spring (Mar-May) | Net injection begins | Demand bottom, prices often weak |
| Summer (Jun-Aug) | Builds continue, AC demand offsets | Range-bound or weak |
| Fall (Sep-Oct) | Builds peak, prepare for winter | Range-bound |
| Early winter (Nov-Dec) | Draws begin | Demand spike, prices firm |
| Mid-winter (Jan-Feb) | Heaviest draws | Highest volatility, weather-driven |
| Late winter (Feb-Mar) | Draws ending | Decline as warmer weather approaches |
These are tendencies, not rules. A mild winter can keep prices weak through January; a polar vortex can spike them in early November.
Leverage on natural gas
Volity supports up to 1:100 on natural gas. The math is sharper than oil because the volatility is higher:
- 1 standard CFD lot = 10,000 MMBtu
- At $3.50/MMBtu, 1 lot notional = $35,000
- At 1:100 leverage, required margin = $350
- A 1% move = $350 = 100% margin destruction
Natural gas can move 3-5% intraday. At 1:100, you can lose your margin many times over within a single day. Most retail strategies on natural gas work better at 1:10 to 1:20 with tight stop-losses.
Common trade setups
1. EIA storage trades. Thursday 10:30 EST. Position before the release based on analyst consensus; profit if actual diverges meaningfully from consensus. High-volatility, high-reward, high-risk.
2. Weather forecast trades. Cold weather forecasts in winter or hot weather forecasts in summer move natural gas. Position before forecast updates; close on the move.
3. Seasonal cycle trades. Long positions in autumn-into-winter; short positions in spring as storage builds. Multi-week holds; use lower leverage and accept swap fees.
4. Storm-disruption trades. Hurricanes threatening Gulf Coast production facilities cause supply-shock spikes. Tactical short-term positions.
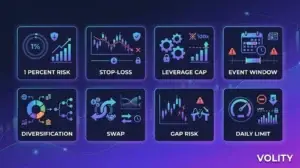
Risk considerations
- Storage surprise volatility. Natural gas has more extreme reactions to EIA surprises than crude oil. Position size accordingly
- Weather forecast errors. Forecasts beyond 7 days are unreliable. Long-dated weather trades carry forecast risk
- Storage cycle mismatch. Mild winters or hot summers can break the seasonal pattern unpredictably
- Liquidity outside US hours. Liquidity thins in Asian-late-night and weekend periods; widen spreads, larger slippage on stops
Cost summary
- Spread on Henry Hub: competitive, visible before order entry
- Swap on overnight: applied at 22:00 GMT
- Commission: $0 on Standard
- FX conversion: 1% on non-USD funding
Sources
Related Volity platforms
- Oil Trading on Volity: WTI & Brent CFDs
- Crude Oil Trading: WTI CFDs on Volity
- Silver Trading on Volity: XAG/USD CFDs
- Commodity Trading Platform on Volity: 150+ Markets
Frequently asked questions
What is natural gas trading?
Natural gas trading speculates on the price of natural gas, primarily via futures or CFDs on Henry Hub (the US benchmark). Volity offers Henry Hub natural gas CFDs with leverage up to 1:100, no expiry, and CySEC-regulated execution under UBK Markets.
Can I trade natural gas on Volity?
Yes. Henry Hub natural gas is available as a CFD on Volity MT with leverage up to 1:100, flexible position sizing (0.01 lot = 100 MMBtu minimum), no expiry, and 24/5 trading hours following the underlying NYMEX futures schedule.
When is the EIA natural gas storage report released?
Every Thursday at 10:30 EST. The report includes total US storage, weekly change (build or draw), and comparison to 5-year average. Market reaction is typically 2-4% within 30 minutes of release. The most predictable retail-tradable natural gas catalyst.
What is the most volatile commodity for trading?
Natural gas is among the most volatile retail-tradable commodities, often more volatile than crude oil. Inelastic demand (heating/power), storage cycle dependence, and weather-driven catalysts combine to produce 3-8% daily moves more frequently than other commodities.
What leverage is safe for natural gas trading?
Volity supports up to 1:100 on natural gas. Given the higher volatility relative to crude oil, most retail strategies work better at 1:10 to 1:20 with tight stop-losses. At 1:100, a 1% move wipes margin, and natural gas can move 3-5% intraday.
What moves natural gas prices?
Five primary drivers: weekly EIA storage report (Thursday 10:30 EST), weather forecasts (heating demand winter, AC summer), seasonal cycle (builds spring/summer, draws winter), supply disruption events (hurricanes, pipeline issues), and macro energy demand signals.
Is natural gas trading profitable?
For disciplined traders with edge, possibly. The higher volatility provides more tradable swings than crude oil but also more whipsaw losses. Realistic retail performance on natural gas reflects the same constraints as commodity trading generally: positive expectancy strategies tend to come from EIA event trading and seasonal cycle plays, with strict position sizing.