The US30 is a contract for difference that tracks the Dow Jones Industrial Average, an index of 30 large United States blue-chip companies. Trading the US30 CFD lets you go long or short on the Dow in a single position on Volity MT, with product-dependent leverage and no share ownership.
What is the US30?
US30 is the CFD ticker most platforms use for the Dow Jones Industrial Average, one of the oldest and most quoted stock indices in the world. The Dow holds 30 large, established United States companies chosen by a committee at S&P Dow Jones Indices to represent the broad economy, spanning technology, healthcare, finance, industry and consumer brands. Membership changes rarely, which gives the US30 index a stable, blue-chip character. If indices are new to you, our explainer on what a stock index is covers the groundwork first.
The Dow has one quirk that sets it apart from almost every other major index: it is price weighted. A company with a higher share price carries more influence than one with a lower share price, whatever the size of the underlying business. That is unusual, and it is the single most important thing to understand before you trade the US30.
Why does price weighting matter?
In a capitalisation weighted index, the largest companies by market value move the index most. In the price weighted Dow, the highest priced shares move it most. A company trading at 500 a share sways the US30 far more than one trading at 100, even where the second business is worth more overall. So when a heavyweight, high priced member reports earnings, the whole index can swing on that one name. Knowing which constituents carry the biggest price weights tells you where the index is most exposed on any given day. The full methodology behind the weighting is published by S&P Dow Jones Indices, the provider that maintains the Dow.
What is the Dow Jones 30 companies list?
The Dow Jones companies list spans 30 members across the major sectors. A representative selection of the index looks like this.
| Company | Sector | Note |
| UnitedHealth Group | Healthcare | Often among the highest price weights |
| Goldman Sachs | Finance | High share price gives it heavy influence |
| Microsoft | Technology | Large technology representative |
| Apple | Technology | Consumer technology anchor |
| Caterpillar | Industrials | Ties the Dow to the industrial cycle |
| Home Depot | Consumer retail | Reads the consumer economy |
| Visa | Financial services | Payments exposure |
| McDonald’s | Consumer | Defensive global brand |
The full Dow Jones 30 companies list rounds out with names across defence, energy, telecoms and consumer staples. Because the roster is small and price weighted, a move in two or three high priced members can set the direction of the US30 for the day.
How does a US30 CFD work?
A US30 CFD is an agreement to exchange the difference in the Dow’s price between the moment you open a position and the moment you close it. You trade the movement of the index rather than owning a slice of it. Unlike buying the 30 shares directly, or holding an index fund or a dated future, the CFD carries no fixed contract size and nothing to roll at expiry, so you can size it to your account and hold it for as long as your plan requires.
- You can go long if you expect the Dow to rise or short if you expect it to fall, with no stock borrowing needed to sell short.
- You post margin instead of the full contract value, with leverage up to 1:500 (product-dependent), which magnifies gains and losses alike and makes position sizing essential.
- You hold no shares and no voting rights, and in place of a payout a dividend adjustment applies when constituents pay dividends, credited to long positions and debited from short ones.
Because leverage magnifies losses as fast as gains, regulators such as the FCA and ESMA restrict how CFDs are sold to retail clients. Read that as a cue to size positions deliberately and cap the risk on every trade.
Volity offers the US30 as a CFD alongside other global index CFDs, forex, commodities and crypto in one account, with CySEC-regulated execution under UBK Markets. You can trade index CFDs on Volity across the major United States, European and Asian benchmarks from the same login.
When can you trade the US30, and what does it cost?
The Dow’s constituents trade during the United States cash session, 09:30 to 16:00 New York time, and that window is when the US30 is most liquid and its spread tightest. The US30 CFD tracks the index right through the trading week and commonly quotes for extended hours around the cash session, so you can still trade reactions to overnight and pre-market news.
Your running costs are the spread in index points, an overnight financing charge on positions held past the daily rollover, and a dividend adjustment that credits long positions and debits short ones. Funding in a currency other than the quote currency involves a 1% conversion. The Markets account carries no separate commission on the US30. Full pricing sits on the charges and fees page.
How do you size a US30 trade and read the chart?
Instead of hunting for a us30 lot size calculator, you can size any trade in three steps and let the order ticket confirm the margin. Sound position sizing is what keeps a single bad trade from denting the account.
- Decide the cash you will risk, for example 1% of your balance.
- Measure the distance in index points from your entry to your stop-loss.
- Divide your cash risk by the point value multiplied by that stop distance to get your position size.
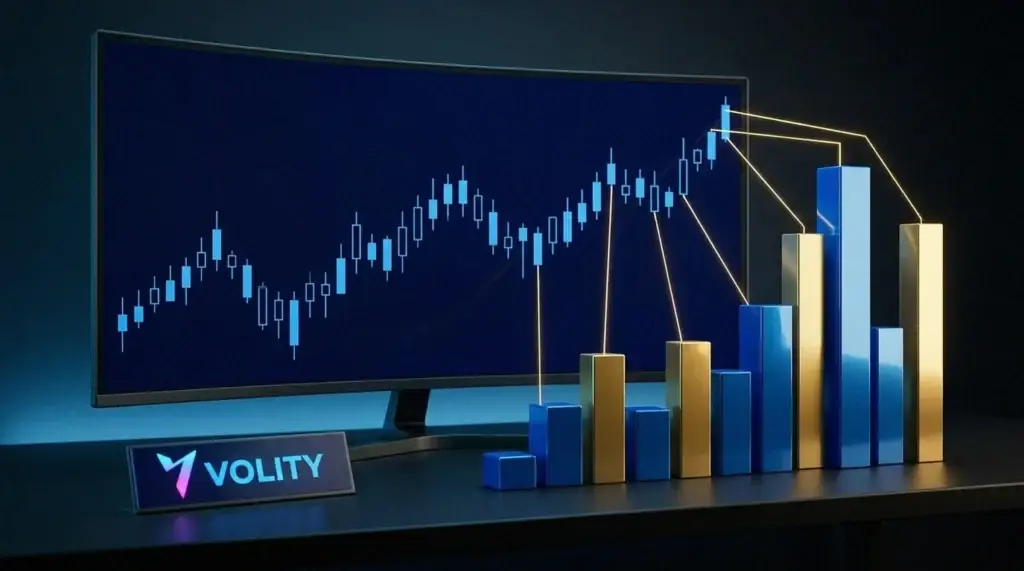
You can plan all of this on the live US30 chart inside Volity MT, which includes TradingView charting. Draw your support and resistance, add the indicators you rely on, and check the current US30 price against your plan before you commit. The chart is there to help you build your own view, and it will never hand you a ready-made buy or sell call.
What moves the US30?
Following the drivers behind the day’s us30 news tends to be more useful than reacting to any single headline. The Dow responds to a familiar set of forces.
- Interest rate policy sets the backdrop, so Federal Reserve decisions and the outlook for rates move the whole United States market, the Dow included.
- Earnings from high priced Dow members can swing the price weighted index sharply on a single result.
- Inflation, jobs and growth data reset expectations for the economy the Dow represents.
- Names like Caterpillar and Home Depot tie the Dow to the pace of industry and consumer spending.
- Broad risk-on and risk-off swings pull the US30 along with the rest of world equities.
How does the US30 compare with the US500 and NAS100?
The three headline United States indices are often quoted together, but they measure different things, and knowing the difference tells you which one fits your view.
| Feature | US30 (Dow) | US500 (S&P 500) | NAS100 (Nasdaq 100) |
| Companies | 30 blue chips | 500 large caps | 100 non-financial |
| Weighting | Price weighted | Capitalisation weighted | Capitalisation weighted |
| Character | Established, broad economy | Broad benchmark | Technology and growth |
| Typical volatility | Lower | Moderate | Higher |
In practice the US30 is the steadiest of the three, because it holds established, dividend-paying blue chips and leaves out the racier growth names. The US500 is the broad benchmark most traders treat as the market itself, while the NAS100 is the high-beta, technology-led index that moves furthest when risk appetite shifts. A calm, value-led session tends to suit the US30, a sharp technology-driven move suits the NAS100, and a read on the whole market points to the US500. Because the three move together but not identically, a signal that shows up across all of them carries more weight than one confined to the price-weighted Dow, where a single high priced member can distort the picture. Many active traders keep the three side by side for exactly that cross-check. For the mechanics of trading any of them, our guide on how to trade indices walks through it.
Related guides
Frequently asked questions
What is the US30 in trading?
The US30 is a CFD that tracks the Dow Jones Industrial Average, an index of 30 large United States blue-chip companies. Trading the US30 gives you exposure to the Dow in a single instrument, so you can go long or short with leverage rather than buying the 30 shares one by one.
How many companies are in the US30?
Exactly 30, which is where the name comes from. They are large, established United States companies selected by a committee at S&P Dow Jones Indices. The index is price weighted, so the highest priced shares carry the most influence rather than the largest companies by market value.
Why is the US30 price weighted?
The Dow has used price weighting since its origins in the nineteenth century, long before market-cap weighting became standard. It means a share trading at a high price moves the index more than a lower priced share, so a single high priced member can drive the US30 on a given day.
Where can I see the live US30 chart?
The live US30 chart is available inside Volity MT, which includes TradingView charting. You can view the current price, draw support and resistance, and add indicators to build your own analysis. The chart supports your decision and does not issue a buy or sell signal for you.