Indices concentrate capital into mega-cap technology stocks that dominate their weightings, a 10% decline in the top 5 companies can erase 2.6% of total index value instantly, despite the index claiming 500 components. Trading indices via leveraged CFDs amplifies both gains and losses; a 5% correction becomes a 50% account drawdown with 10x leverage, triggering forced liquidations during gap events. Systemic market shocks create “broad-based” crashes where diversification fails, during the March 2026 geopolitical shock, all major indices fell together as the equity risk premium compressed to negative territory. Past performance is not indicative of future results. Capital at risk.
Indices are rules-based aggregations of securities that track specific market segments or entire economies. These benchmarks provide institutional-grade signals for risk management and speculative trading. As of early 2026, global index fund AUM has surpassed $20 trillion, reflecting the total dominance of passive investment strategies in modern financial markets.
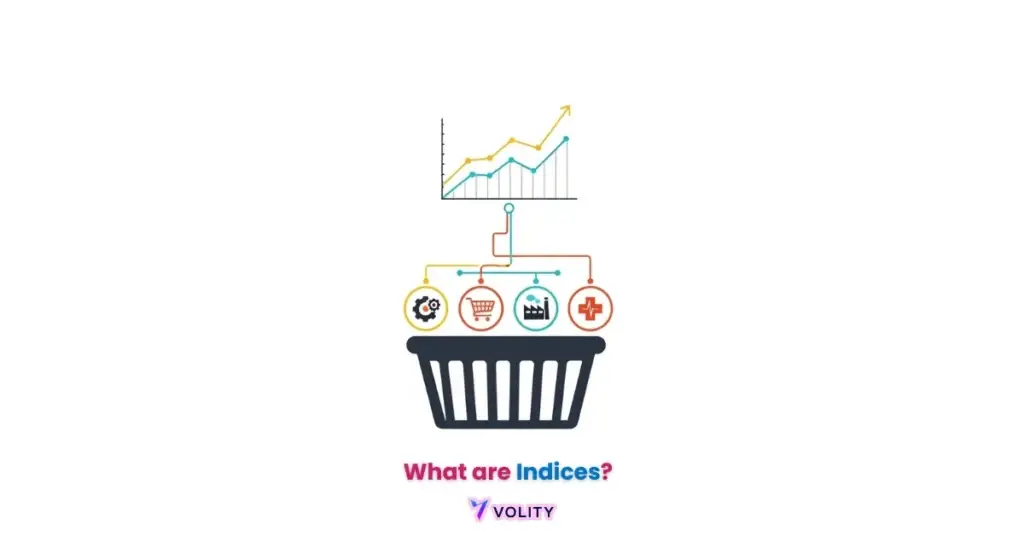
Indices function as the essential nervous system of global finance, aggregating price data from thousands of companies into single, actionable numbers. This mechanism allows participants to gauge the “temperature” of a sector without analyzing every individual constituent. Stocks Investing for Beginners introduces foundational equity concepts, while Risk Management guides traders on position sizing and capital preservation alongside index exposure.
The 2026 trading environment is characterized by historic concentration levels in mega-cap technology stocks, particularly within the S&P 500 and Nasdaq. Traders utilize indices to manage broad exposure while hedging against the idiosyncratic risks of single-stock volatility. The BlackRock Global ETF Landscape 2026 documents how $20 trillion in global assets are now passively indexed, creating self-reinforcing capital flows into benchmark constituents.
While understanding What Are Indices is important, applying that knowledge is where the real growth happens. Create Your Free Forex Trading Account to practice with a free demo account and put your strategy to the test.
Indices: Understanding Market Benchmarks and Trading Strategies in 2026
What are indices and how do they function in 2026?
Indices are quantitative descriptions of market performance based on a standardized rulebook for constituent selection and weighting. An index is not itself a tradable asset but rather a mathematical construct that serves as a reference point for evaluating portfolio performance and market trends. The “divisor” maintains price continuity when companies split shares or when reconstitutions occur, ensuring the index value reflects only price movements, not corporate actions.
Primary index providers, S&P Dow Jones, MSCI, FTSE Russell, and Nasdaq, establish the rules for how constituents enter, exit, and receive weight within their benchmarks. These organizations conduct quarterly reconstitutions where underperforming companies are replaced with rising stars, creating a “survivorship bias” that automatically removes dead weight. Passive fund assets now exceed 55% of total global managed assets as of Q2 2026, meaning indices have become the primary allocation tool for the majority of institutional and retail capital (Global Investment Data, 2026).
The Anatomy of a Market Benchmark
A market benchmark is a specific index used as a standard against which the performance of other assets or portfolios is measured. Reconstitution schedules occur quarterly for most major indices, with S&P 500 changes announced well in advance to allow active managers time to reposition before the changes take effect. Float-adjusted market capitalization differs from total market capitalization by excluding locked-up shares held by founders and insiders, ensuring the weighting reflects only tradable liquidity available to public investors. Portfolio Rebalancing becomes critical when index constituent weights drift from their rulebook allocations, requiring periodic index fund rebalancing to maintain target diversification.
The S&P Dow Jones Indices Methodology document provides full transparency into calculation rules and divisor adjustments, allowing traders to understand precisely how index values are determined and maintained across all market conditions.
Ready to Elevate Your Trading?
You have the information. Now, get the platform. Join thousands of successful traders who use Volity for its powerful tools, fast execution, and dedicated support.
Create Your Account in Under 3 MinutesWhat are the top stock market indices to watch in 2026?
Global financial indices identify the economic health of specific regions, ranging from the U.S. technology sector to European industrials. The S&P 500 remains the definitive barometer for the American economy, capturing 500 large-cap companies that represent approximately 80% of total U.S. market capitalization. The Nasdaq-100 serves as the epicenter of the 2026 AI infrastructure boom, heavily weighted toward technology and semiconductor companies driving the current bull market narrative.
The DAX 40 represents German manufacturing and export strength, providing critical insight into European industrial health during periods of geopolitical tension and trade volatility. The Nikkei 225 functions as the primary gauge for Asian trade and yen-denominated equity performance, offering exposure to Japan’s automotive and electronics leaders. In May 2026, Nvidia Corp. became the largest single constituent in the S&P 500 with a weight of approximately 8.24%, representing the extreme concentration of mega-cap technology within the world’s most influential index (SPY ETF Data, 2026).
Best Trading Platforms enable institutional and retail traders to access index CFDs with leverage, while the SSGA SPY ETF Top 10 Holdings document reveals the exact weight of concentration risk within the most widely held index fund globally.
How is a market-cap-weighted index calculated?
Market-capitalization weighting is a methodology where each constituent’s influence on the index is proportional to its total market value. The formula operates as: (Share Price × Shares Outstanding) / Index Divisor = Index Value. This divisor is set by index providers and adjusts periodically to maintain continuity when companies undergo stock splits, reconstitutions, or significant corporate actions that would otherwise distort the index artificially.
Price-weighting represents a fundamentally different approach where the Dow Jones Industrial Average determines constituent influence based solely on share price, meaning a $500-per-share company receives disproportionate weight compared to a $50-per-share company regardless of market capitalization. Equal-weighting gives every constituent identical impact on the index value, creating a baseline comparison showing whether index returns are driven by large-cap dominance or broad-based strength. Fundamental Analysis techniques help traders understand whether each constituent’s weight within an index reflects genuine earnings growth or speculative valuation expansion.
Real trading example: In Q1 2026, technology mega-caps rallied aggressively while 400 of the 500 S&P stocks remained flat or declined. The market-cap weighted S&P 500 index rose 5%, capturing the mega-cap surge and delivering strong benchmark returns. The equal-weighted Russell 1000 Equal Weight ETF (RSP) stayed at 0%, highlighting the “narrow breadth” of the rally and revealing that the traditional index return masked widespread weakness in mid-sized and small-cap stocks. Past performance is not indicative of future results.
Why are indices useful during periods of market volatility?
Index diversification metrics identifies the historical volatility reduction provided by broad market benchmarks compared to individual equities. Holding 500 stocks through an index fund produces annualized volatility of 17.2% historically, compared to single-stock volatility exceeding 40% for growth stocks and 50%+ for technology leaders. This diversification benefit represents the core value proposition of index investing, spreading idiosyncratic risk across numerous companies and sectors to reduce total portfolio volatility.
| Index Name | 2026 Primary Sector | Annualized Volatility (5-yr) | Weight of Top 10 | Benchmark Type |
| S&P 500 | Info Tech (34%) | 17.2% | ~39.2% | Market-Cap |
| Nasdaq-100 | Technology (51%) | 22.8% | ~48.5% | Modified-Cap |
| FTSE 100 | Financials (19%) | 14.5% | ~32.0% | Market-Cap |
| DAX 40 | Industrials (21%) | 18.9% | ~41.0% | Market-Cap |
| Russell 2000 | Health Care (18%) | 24.5% | ~5.5% | Small-Cap |
Sources: Data compiled from S&P Global, MSCI, and Bloomberg Terminal (May 2026).
Is the S&P 500 expected to rise or fall in 2026?
Concentration risk indicators represent the primary catalyst for S&P 500 price action as the index navigates the ‘Great Narrowing’ of the 2026 market. The “Effective N” of the S&P 500 has collapsed to 54, meaning the 500-stock index behaves economically like a 54-stock concentrated basket where mega-cap technology dominates all price discovery. The impact of AI CAPEX spending on the “Magnificent 7” (Nvidia, Tesla, Microsoft, Apple, Amazon, Google, Meta) and their 40% weight in the index creates an asymmetric risk profile where a sustained AI boom drives index highs, while any AI thesis reversal triggers cascade liquidations across tech concentration.
Bull case for the second half of 2026 rests on AI infrastructure capital expenditure continuing at $500+ billion annually, sustaining earnings growth for semiconductor and cloud leaders. Bear case identifies that current valuations already incorporate 15+ years of consensus AI adoption, leaving limited upside cushion for disappointments. Market Volatility often intensifies at inflection points where consensus shifts from “AI growth is guaranteed” to “AI growth requires proof of ROI for enterprise customers.”
Turn Knowledge into Profit
You have done the reading, now it is time to act. The best way to learn is by doing. Open a free, no-risk demo account and practice your strategy with virtual funds today.
Open a Free Demo AccountHow to start trading indices effectively in 2026
Index trading strategies requires a fundamental understanding of correlation, leverage, and the underlying sector composition of each benchmark. Trading via CFDs provides access to index leveraged exposure, allowing a trader to control $100,000 of index value with $5,000 in capital and 20x leverage. ETFs and index mutual funds require full capital upfront with no leverage but offer passive buy-and-hold simplicity without forced liquidation risk from margin calls.
The importance of “Sector Rotation” emerges during market regime transitions, when growth slows and interest rates stabilize, rotating from Nasdaq (Growth/Technology) into Dow Jones (Value/Industrials) captures the rotation mechanics before they fully price into index valuations. Using the VIX (Volatility Index) as a “fear gauge” to time index entries identifies buying opportunities when market panic spikes the VIX above 30, historically preceding 10%+ gains within 60 days as panic capitulation creates washout bottoms.
ETF Exchange Traded Funds provide the simplest index exposure for retail traders, with SPY (S&P 500 ETF) trading over 300 million shares daily. Best Index Trading Strategies documents professional approaches including pairs trading (long Nasdaq, short Russell 2000), sector relative value rotation, and volatility arbitrage between the index and its constituents.
Key Takeaways
- [Indices] are rules-based financial benchmarks that measure the aggregate performance of a specific group of stocks or market sectors.
- [Diversification] is the primary benefit of index trading, as it spreads exposure across multiple companies to mitigate individual stock risk.
- [Market-cap weighting] remains the dominant calculation method, where larger companies like Nvidia and Apple exert the most influence on index value.
- [Concentration risk] has reached historic levels in 2026, with the top 10 constituents of the S&P 500 accounting for nearly 40% of the total weight.
- [Passive management] now controls over 55% of global assets, ensuring continuous capital flows into major index constituents regardless of fundamentals.
- [Index trading] via CFDs or ETFs allows investors to speculate on entire economies with lower capital requirements than buying individual shares.
Frequently Asked Questions
This article contains references to Indices and Volity, a regulated CFD trading platform. This content is produced for educational purposes only and does not constitute financial advice or a recommendation to buy or sell any financial instrument. Always verify current regulatory status and platform details before using any trading service. Some links in this article may be affiliate links.