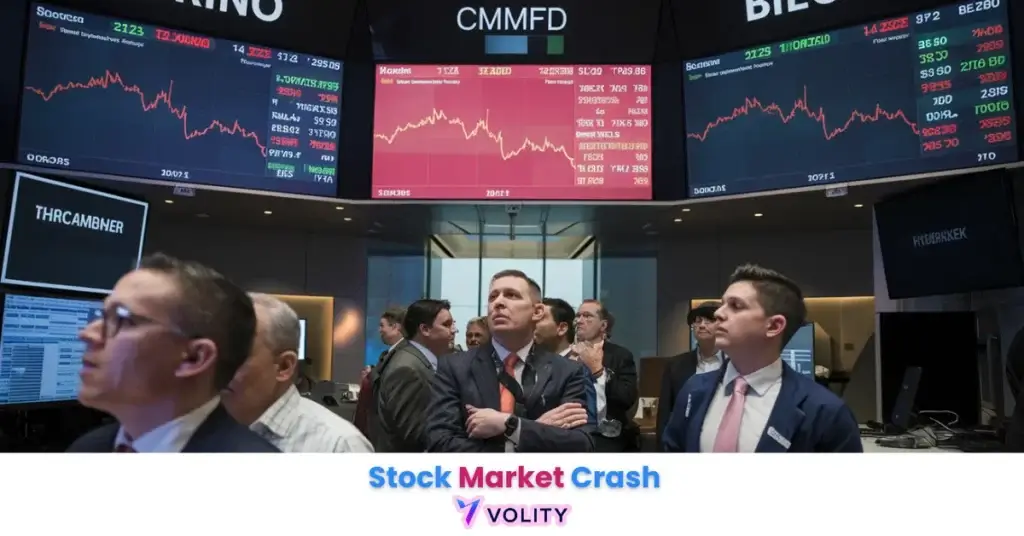
Crashes create permanent capital destruction when investors sell at the bottom, the 2026 Iran Shock erased $3.2 trillion in market cap in eight weeks, and those who capitulated at -9.5% locked in losses before the 14% recovery. Circuit breaker halts can gap through support levels when Level 1 and 2 halts are disabled after 3:25 PM ET, the final 35 minutes of trading can see unhalted 13%+ declines that skip circuit breaker protection entirely. Margin call cascades during crashes create forced liquidation spirals where overleveraged investors selling high-quality assets at the lows create negative feedback loops that accelerate price declines. Past performance is not indicative of future results. Capital at risk.
A stock market crash identifies a sudden, double-digit decline in equity prices across a broad market index, typically triggered by an unexpected geopolitical “black swan” or a systemic liquidity failure. In 2026, the primary example of this volatility was the March “Iran Shock,” which saw the S&P 500 drop 9.5% in eight weeks as Brent crude spiked above $103. By understanding the three-tier system-wide circuit breaker framework (7%, 13%, and 20%), investors can navigate high-panic environments without succumbing to the emotional pressures of forced liquidation.
While understanding Stock Market Crashes is important, applying that knowledge is where the real growth happens. Create Your Free Forex Trading Account to practice with a free demo account and put your strategy to the test.
What is a stock market crash and how does it start?
A stock market crash is a sudden and significant decline in stock prices across a major index, identifying a systemic failure of buyer confidence. The distinction between a crash and a bear market is velocity: a crash typically occurs over days to weeks (9.5% in 8 weeks in March 2026), while a bear market develops over months to years of steady deterioration. Crashes are triggered by black swan events, unexpected geopolitical conflicts, economic bubbles that suddenly collapse, or systemic liquidity failures where “bid-ask” spreads widen dramatically and buyers simply vanish.
Liquidity evaporation explains the severity of crashes: stock prices require a continuous stream of buyers to maintain current levels; when confidence collapses, this supply of buyers evaporates instantly, causing prices to “gap down” 5-10% just to find a new equilibrium. In March 2026, the S&P 500 experienced a 7.4% monthly decline according to market data, its worst performance in nearly four years, driven by the outbreak of conflict in the Middle East that sent Brent crude surging toward $103 per barrel.
The 2026 “Iran Shock” Case Study
The Iran Shock identifies the 2026 geopolitical catalyst that triggered a 9.5% peak-to-trough drawdown in the S&P 500 during the first quarter. The shock began with escalating tensions in the Middle East and crude oil futures spiking above $103 per barrel, triggering an immediate reassessment of inflation expectations. The Federal Reserve signaled a delay in anticipated rate cuts from July to September as energy-driven inflation resurfaced, creating a “double negative” for equities: higher energy costs for corporations plus sustained high rates for longer. The initial panic lasted eight weeks, with the S&P bottoming at 6,315 in mid-March, erasing $3.2 trillion in market capitalization and triggering the widespread deployment of margin call liquidations.
Ready to Elevate Your Trading?
You have the information. Now, get the platform. Join thousands of successful traders who use Volity for its powerful tools, fast execution, and dedicated support.
Create Your Account in Under 3 MinutesModern Circuit Breakers: NYSE Rule 7.12
System-wide circuit breakers identify the regulatory thresholds that trigger mandatory trading halts to prevent disorderly market collapses. The three-tier circuit breaker system was implemented after the 1987 Black Monday crash (22.6% single-day decline) and has been refined through 2026 to prevent a repeat of total market free-fall. Level 1 triggers at a 7% decline in the S&P 500 (approximately 500 points at current levels), halting all trading for 15 minutes to allow investors to absorb news and restore orderly bidding. Level 2 triggers at a 13% decline, triggering a second 15-minute halt during extreme intraday panic. Level 3 triggers at a 20% decline, suspending trading for the remainder of the session entirely.
The critical 2026 modification involves the 3:25 PM ET exclusion: under NYSE Rule 7.12 System-Wide Circuit Breakers, Level 1 and 2 halts are strictly excluded after 3:25 PM ET, identifying the final 35 minutes of trading as a high-volatility window where prices can drop more than 13% without triggering a mandatory halt. This rule was added to prevent endless circuit breaker halts from cascading into the next day, but it creates a significant structural vulnerability in the final hour. Market Volatility often spikes during the 3:25-4:00 PM window as momentum traders and automated systems execute end-of-day unwinding without circuit breaker protection.
The Anatomy of a V-Shaped Recovery in 2026
A V-shaped recovery identifies a rapid market rebound where prices return to pre-crash levels within a few weeks of the initial washout. The mechanics of a V-shaped recovery in 2026 differ significantly from the multi-year recoveries of the 20th century, algorithmic de-risking leads to fast capitulation bottoms (6,315 in March 2026) followed by aggressive algorithmic re-risking that drives prices higher almost as rapidly. The Washout Bottom represents the point where maximum pessimism meets maximum forced liquidation; identifying this point requires recognizing extreme Market Cycles indicators like VIX above 30 and panic selling across all sectors simultaneously.
Real trading example: A trader identified the 6,315 support level in March 2026 as the VIX hit 31% and Brent crude prices stabilized after failing at $110 per barrel. The trader recognized that the worst fundamental news (rate cut delays) was already priced in, and began accumulating exposure systematically over the following week. The S&P 500 staged a V-shaped recovery, rallying 14% in five weeks to reach new all-time highs above 7,200 by late April, successfully rewarding the patient “dip buyers” who refused to capitulate at the psychological bottom. Past performance is not indicative of future results.
2026 Crash Benchmarks and Historical Context
Drawdown benchmarks identify the magnitude and duration of 2026 market declines relative to historic crashes in 1929, 2008, and 2020.
History gives a vivid example. The speculator Jesse Livermore reportedly made around 100 million dollars by short selling the crash of 1929, a reminder that a falling market can be prepared for rather than simply feared.
| Crash Event | Duration (Peak-Low) | Max Drawdown | Recovery Time | Primary Catalyst |
| 2026 Iran Shock | 8 Weeks | -9.5% | 5 Weeks | Energy / Geopol. |
| 2020 COVID | 1 Month | -34% | 5 Months | Global Pandemic |
| 2008 GFC | 18 Months | -56% | 4 Years | Credit / Housing |
| 1987 Black Mon. | 1 Day | -22.6% | 20 Months | HFT / Portfolio |
| 1929 Great Dep. | 3 Years | -89% | 25 Years | Bubble / Margin |
The 1929, 1987, 2008 and 2020 rows are the standard peak-to-trough figures for those episodes. The 2026 row is a running estimate of an episode that is still recent and should be treated as approximate.
The 2026 Iran Shock demonstrates how modern circuit breakers and algorithmic dynamics have compressed crash duration compared to 1987 (20-month recovery) and 2008 (4-year recovery). The 2020 COVID crash was more severe (-34%) but recovered faster (5 months) due to aggressive Federal Reserve intervention. The 1929 crash and subsequent Great Depression lasted three years with an 89% drawdown because there were no circuit breakers, no central bank intervention, and widespread margin liquidation cascades that compounded the initial collapse. Historical context reveals that crashes in the modern era (2008+) recover 10-20x faster than pre-circuit-breaker crashes, primarily due to automated stabilization mechanisms and institutional policy responses.
The Psychology of a Crash: Why Investors Sell at the Bottom
Emotional contagion indicates that mass panic often forces rational investors to sell their high-quality assets at the point of maximum financial pain. During the March 2026 crash, the circuit breaker halt at -7% triggered intense emotional pressure: trading stopped for 15 minutes, news coverage screamed headlines about crashes and collapses, and margin calls arrived simultaneously across millions of brokerage accounts. When trading resumed, the S&P 500 often gapped down another 2-3%, triggering a cascading series of margin calls that forced selling even among investors who had no intention of exiting.
Recency bias creates the mistaken belief that because prices fell 9.5% in eight weeks, they will fall another 20% the following week, justifying capitulation sales at the worst possible moment. The amygdala, the primitive fear center of the brain, literally takes over during a 7% circuit breaker halt, overriding the rational prefrontal cortex that would recognize the crash as a buying opportunity. Forced Liquidation via margin calls compels selling at lows because brokers demand capital within hours, leaving no time for rational analysis. Stock market bubble discussions often reference crashes as the “pop,” but psychological research reveals that crashes trigger more regret and capitulation than bubbles trigger euphoria, meaning crashes create more damage to retirement portfolios than bubbles create in overconfidence gains.
Turn Knowledge into Profit
You have done the reading, now it is time to act. The best way to learn is by doing. Open a free, no-risk demo account and practice your strategy with virtual funds today.
Open a Free Demo AccountStep-by-Step: How to Prepare Your Portfolio for a Crash
Crisis preparation represents the most effective strategy for ensuring that a market crash identifies an opportunity rather than a catastrophe. Begin by maintaining a 20% Cash Buffer during bull markets, this “dry powder” reserve ensures that when crashes create 30-50% discounts, you have capital available to accumulate high-quality assets at the washout bottom (6,315 in March 2026). During the Iran Shock, investors with no cash were forced to watch helplessly as prices fell; those with 20% cash reserves could accumulate the S&P 500 at historic discounts to buy the dip and capture the 14% recovery that followed.
Defensive Rotation in advance of shocks involves shifting portions of your portfolio into sectors that historically outperform during crashes. Energy was the strongest sector of March 2026 by a wide margin while technology and consumer discretionary were the weakest, demonstrating the protective power of sector rotation when geopolitical risks emerge. Tail-Risk Hedging using protective puts creates a price floor: a 5% out-of-the-money put option on the S&P 500 caps the drawdown below the strike while leaving the upside open. The premium is not fixed; it rises sharply with implied volatility, so the cheapest time to buy protection is before the market wants it. How to Hedge Stocks techniques become essential during high bubble valuations where the probability of a crash increases meaningfully. Set Stop-Loss Order trailing stops at 15% below recent highs, these mechanical exits prevent emotional panic selling at the absolute bottom while preserving capital during the early stages of deterioration.
Key Takeaways
- A stock market crash is a rapid, systemic decline in equity prices, often exceeding 10% within a very short timeframe.
- System-wide circuit breakers are mandatory halts at 7%, 13%, and 20% drops, identifying regulatory pauses to prevent total collapse.
- The March 2026 shock resulted in a 9.5% peak-to-trough drawdown, triggered by geopolitical instability and Brent crude spikes.
- V-shaped recoveries have become more common in 2026, as algorithmic de-risking leads to fast washouts followed by aggressive buying.
- The 3:25 PM rule prevents circuit breaker halts in the final 35 minutes of trading, identifying a high-risk window for unhalted panic.
- Energy sector resilience was proven during the 2026 shock, as it led every other sector in March while tech and consumer discretionary took the sharpest losses.
Frequently Asked Questions
This article contains references to Stock Market Crash and Volity, a regulated CFD trading platform. This content is produced for educational purposes only and does not constitute financial advice or a recommendation to buy or sell any financial instrument. Always verify current regulatory status and platform details before using any trading service. Some links in this article may be affiliate links.