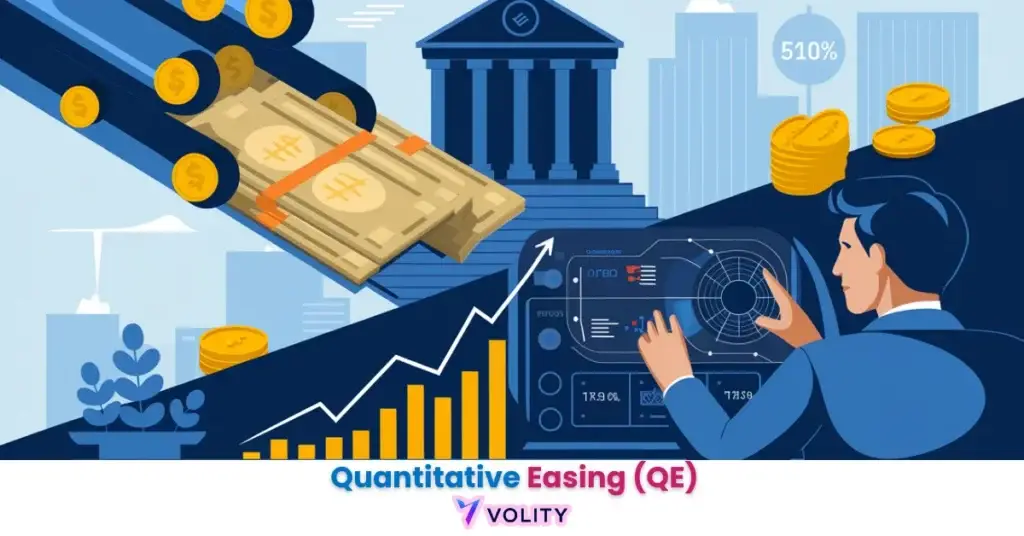
Quantitative Easing masks underlying insolvency risks, when central banks purchase massive bond holdings, they suppress yields artificially, preventing defaulting governments from feeling market discipline until the moment QE stops. QT-driven liquidity withdrawal creates sudden flash crashes in sovereign bond markets where the private sector struggles to absorb trillions in newly-unwanted debt; volatility can rise sharply and without warning. Asset bubbles created by QE programs inflate unprofitably in tech and real estate, and when QE terminates, these bubbles collapse with devastating losses for retail investors who entered late. Past performance is not indicative of future results. Capital at risk.
Quantitative Easing (QE) identifies the unconventional monetary tool where a central bank purchases long-dated government bonds to inject liquidity into the banking system and lower long-term interest rates. In 2026, the global economy has transitioned into a period of “Active Quantitative Tightening” (QT), where major banks like the ECB and Bank of Japan are aggressively shrinking their balance sheets to normalize policy. By understanding the three transmission channels of QE, portfolio rebalancing, signaling, and the wealth effect, investors can better navigate the liquidity shifts that drive modern asset valuations. The size and pace of the ECB’s portfolio run-off are published by the ECB itself; the direction of travel, from accommodation to tightening, is what changes the liquidity backdrop.
While understanding Central Bank Monetary Policy is important, applying that knowledge is where the real growth happens. Create Your Free Forex Trading Account to practice with a free demo account and put your strategy to the test.
Quantitative Easing functions as a powerful liquidity-injection mechanism designed to lower borrowing costs for businesses and consumers. This methodology identifies securities, ranging from government Treasuries to mortgage-backed bonds, that central banks acquire to flood the financial system with electronic reserves. It serves as the foundational architecture for modern crisis-response and inflation management in 2026, acting as the primary tool when traditional rate cuts cannot stimulate activity.
The 2026 monetary landscape is defined by the “Great Normalization” as global banks unwind years of record-breaking QE programs. Investors utilize Central Bank Influence metrics and Inflation Protection strategies to distinguish between genuine economic expansion and liquidity-driven asset bubbles in a multipolar world where policy coordination has fractured.
What is Quantitative Easing and how does it function?
Quantitative Easing is an unconventional monetary policy tool used by central banks to increase the domestic money supply by purchasing large amounts of long-term government bonds. Unlike traditional interest rate cuts, QE does not reduce the Fed Funds Rate (which reaches zero lower bound during crises) but instead increases the total quantity of money in circulation through direct asset purchases. This direct balance-sheet expansion operates through three distinct transmission channels: Portfolio Rebalancing (investors forced to sell bonds move capital into stocks and credit), Interest Rate Signaling (the bank’s commitment to sustained purchases lowers long-term yield expectations), and the Wealth Effect (rising asset prices from QE-driven demand make consumers feel wealthier and spend more).
Electronic Reserves clarifies a critical misconception, QE does not involve printing physical currency but rather expanding reserve balances that banks hold at the Federal Reserve. Three metrics gauge policy transmission: the central bank’s own portfolio holdings, the level of reserve balances in the banking system, and the term premium. The Federal Reserve publishes the first two for its System Open Market Account, and the Bank of England publishes the equivalent for its Asset Purchase Facility. Yield Compression demonstrates the mechanical outcome: when a central bank purchases $500 billion in 10-year Treasuries, demand for bonds increases, prices rise, and yields fall, making borrowing cheaper for corporations and governments trying to service existing debt.
QE vs. QT: The Balance Sheet Cycle
Quantitative Tightening (QT), a core tool of tight monetary policy, identifies the reverse process where central banks shrink their balance sheets by selling bonds or letting them mature without reinvestment. The distinction that matters is passive versus active: passive QT lets bonds mature without reinvestment, while active QT sells holdings before maturity. Active QT withdraws liquidity faster and returns supply to the market on the central bank’s timetable rather than the bond’s. Impact on the “Money Multiplier” effect becomes severe: when central banks drain reserves from the banking system, the multiplication of deposits shrinks, reducing the total money supply and tightening financial conditions across markets.
Ready to Elevate Your Trading?
You have the information. Now, get the platform. Join thousands of successful traders who use Volity for its powerful tools, fast execution, and dedicated support.
Create Your Account in Under 3 MinutesThe 2026 “Active QT” Regime: Fed, ECB, and BoJ
Active Quantitative Tightening identifies the current global monetary regime where central banks are aggressively reducing liquidity to combat persistent energy-driven inflation. The Eurosystem balance sheet expanded dramatically during the 2020-2023 crisis response, and the run-off since then is set out in the ECB’s asset purchase programmes pages. The Federal Reserve is draining liquidity the slower way, letting securities roll off at maturity without reinvestment rather than selling them. The Bank of Japan represents the most historic shift of the three, raising its policy rate away from near-zero for the first time in decades and tapering its bond buying; every decision and the purchase schedule behind it appear in its monetary policy releases.
Quantitative Easing programs deployed during the pandemic were designed as temporary crisis measures, but their combination with record fiscal stimulus created sustained inflation that forced central banks to reverse policy faster than originally intended. The global coordination that existed during 2008-2009 crisis response has fragmented in 2026, the ECB accelerates QT while some emerging markets still struggle with high debt costs, creating policy divergence that destabilizes currency markets.
The Impact of QE on Stocks, Gold, and Crypto
Liquidity injections identify the primary driver of asset price inflation, as QE-driven reserve expansion forces investors into higher-risk equities and hard assets searching for yield. The Equity “Lifeline” effect works mechanically: QE reduces bond yields, making stocks relatively more attractive for income, which drives capital into equities even when underlying corporate earnings don’t justify the valuations. Gold works as a hedge in this regime because it has no coupon to discount: when investors brace for the inflationary tail of previous QE cycles and for currency debasement from competing stimulus programmes, the metal is bid for the same reason the bonds are sold. Tokenized Real-World Assets demonstrate extreme sensitivity to central bank “Liquidity Pulses”, digital asset valuations spike during QE announcements and collapse during QT periods as speculation unwinds without central bank support.
How the trade is framed: a term premium that turns positive after a long negative stretch is the market re-pricing the compensation it demands for duration once the central bank stops absorbing supply. A trader reading that as the regime shift from QE-suppression to QT-discovery expresses it by shortening duration, not by taking a view on the next meeting. Past performance is not indicative of future results.
2026 Global Monetary Policy Benchmarks
Policy benchmarks identify the current interest rate targets and balance sheet reduction paces for the world’s leading central banks. These metrics reveal the divergence in monetary policy that characterizes the 2026 environment, where not all central banks have reached the same stage of normalization.
| Central bank | Balance-sheet tool | Where the official figures are published |
| Federal Reserve | System Open Market Account holdings, roll-off at maturity | Open market operations |
| ECB | APP and PEPP portfolios and reinvestment policy | Asset purchase programmes |
| Bank of Japan | JGB purchase schedule and policy rate | Monetary policy releases |
| Bank of England | Asset Purchase Facility and gilt sales | Monetary policy |
The spread between the Fed and ECB policy rates reflects divergent inflation pressure and labour-market conditions, and it is the spread rather than either level that drives the currency pair. The Bank of Japan’s move away from the zero bound ends a policy that had persisted for roughly a quarter of a century. The mechanical point underneath all of it: when central banks stop buying, they stop being buyers, and a source of technical support for asset prices is removed whether or not the policy rate moves at all.
The Risks of QE: Asset Bubbles and Devaluation
Unintended consequences indicate that prolonged QE programs often lead to artificial asset bubbles and the erosion of consumer purchasing power. Wealth Inequality emerges because QE disproportionately benefits the top 1%, stock and real estate prices inflate while wages for non-asset-owners stagnate, widening the wealth gap. Currency Devaluation follows from excessive money supply expansion: when a central bank increases reserves by 50% while real economic output only grows 3%, the currency must lose purchasing power to restore equilibrium, benefiting exporters while harming consumers buying imported goods.
The “Exiting Problem” crystallizes in 2026 as central banks attempt unwinding, governments have become addicted to low rates and cannot service their expanded debt burdens at normalized rates, forcing policy makers to choose between letting debt spiral or maintaining QE despite inflation. Professional analysts use “Reserve Balance Analysis” to identify the exact point where QT creates a liquidity shortage in the private repo markets, signaling a potential policy pivot before official communications arrive. Market Volatility spikes dramatically during these liquidity transitions, sudden reversals occur when central banks fear financial system instability and rush to re-inject liquidity after withdrawing too aggressively.
Turn Knowledge into Profit
You have done the reading, now it is time to act. The best way to learn is by doing. Open a free, no-risk demo account and practice your strategy with virtual funds today.
Open a Free Demo AccountStep-by-Step: How to Position Your Portfolio for QT
Portfolio repositioning represents the most effective method for protecting wealth during the current 2026 transition from easing to tightening. Moving into Quality prioritizes companies with high free cash flow, businesses that don’t depend on cheap debt to finance operations survive QT without collapse. Adjusting Bond Duration becomes critical during QT: shorter-dated bonds experience smaller price declines than long-duration instruments when yields rise, so shifting from 10-year Treasuries toward 2-5 year notes reduces interest rate risk.
Hard Asset Allocation increases exposure to Copper, Gold, and Energy as a hedge against fiat devaluation, as central banks drain liquidity, hard commodities maintain purchasing power while currencies depreciate. What are Bonds provides the foundational knowledge for understanding why bond prices decline when interest rates rise during QT phases. How to Hedge Stocks teaches the tactical methods for protecting equity portfolios during liquidity contractions, protective puts, sector rotation toward quality, and inverse ETFs become essential tools for surviving sudden market downturns triggered by QT surprises.
Key Takeaways
- Quantitative Easing is an unconventional monetary tool used to inject liquidity into the banking system by purchasing government bonds.
- Market liquidity is directly impacted by central bank balance sheets, with QE typically boosting asset prices while QT creates a headwind.
- Active QT is the dominant global regime in 2026, as the Fed, ECB, and Bank of Japan reduce their holdings to normalize financial conditions.
- Term premium is a critical metric for 2026 investors, identifying the additional return demanded for holding long-dated bonds without QE support.
- Asset price inflation is a primary risk of QE, often leading to bubbles in tech stocks and real estate due to artificially low borrowing costs.
- Portfolio positioning in 2026 requires a focus on quality cash flows and hard assets to survive the liquidity drain caused by global QT programs.
Frequently Asked Questions
This article contains references to Quantitative Easing (QE) and Volity, a regulated CFD trading platform. This content is produced for educational purposes only and does not constitute financial advice or a recommendation to buy or sell any financial instrument. Always verify current regulatory status and platform details before using any trading service. Some links in this article may be affiliate links.