Index trading exposes traders to concentration risk where 10-15 stocks drive the majority of index price movement in 2026. Leverage amplifies losses during rapid volatility spikes, particularly when 0DTE option expirations force sudden reversals within the final hour of trading. Index CFDs use margin and leverage which can result in losses exceeding your deposit if prices move against your position. Past performance is not indicative of future results. Capital at risk.
Index trading identifies the performance trajectory of a defined stock market segment through a single financial instrument. This methodology functions as a low-friction vehicle for global diversification. Institutional research confirms that S&P 500 earnings are projected to expand by 21% in 2026, identifying high-quality earnings as the primary driver for major index appreciation this year.
While understanding Index Trading Frameworks is important, applying that knowledge is where the real growth happens. Create Your Free Forex Trading Account to practice with a free demo account and put your strategy to the test.
Index trading functions as the primary method for retail and institutional investors to access broad market trends without the idiosyncratic risk of individual stock picking. This process identifies the aggregate value of leading corporations, such as those in the S&P 500 or Nasdaq 100, providing a diversified alternative for capital allocation. It serves as a foundational strategy for long-term wealth building in 2026.
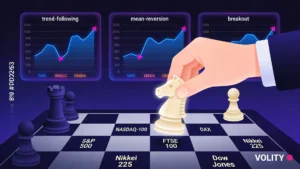
The 2026 trading environment requires a sophisticated understanding of how indices respond to macroeconomic data and algorithmic flow. Investors utilize diverse wrappers, including ETFs and CFDs, to navigate a landscape defined by rapid sector rotation and AI-driven growth. During this period, Market Volatility has reached levels where index movements are increasingly driven by options hedging rather than fundamental earnings expectations.
What are stock indices and how do they function?
A stock index is a mathematical measurement of a specific market or sector, identifying the weighted performance of its underlying constituent companies. Indices measure how a defined basket of stocks performs collectively, providing transparency for institutional capital allocation decisions and retail trading strategies. The calculation methodology reveals whether larger companies exert greater influence on the benchmark or whether all constituents contribute equally.
Market-cap weighting identifies the dominant construction method used by the S&P 500, Nasdaq-100, and most passive index funds globally. In this system, larger companies, Microsoft at $3 trillion market capitalization, exert 3x the influence of a $1 trillion company, creating a weighting based purely on size. Index rebalancing occurs quarterly or semi-annually, removing companies that no longer meet size requirements and adding newly eligible constituents to reflect current market structure.
The S&P 500 functions as the primary barometer of US economic health, representing the 500 largest publicly traded American corporations and approximately 85% of available US market capitalization. In 2026, the trailing three-year standard deviation measures approximately 13.1%, indicating that broad index investing typically reduces volatility compared to individual stock selection (S&P Dow Jones Indices, 2026). This volatility smoothing occurs because idiosyncratic company-specific risks cancel out when aggregated across hundreds of constituents.
The Evolution of Global Benchmarks (SPX, NDX, DAX)
Major global indices identify the specific economic strengths of different regions, ranging from US technology growth to European industrial cyclicality. The S&P 500 (SPX) captures broad US earnings across all sectors, while the Nasdaq 100 (NDX) concentrates exposure to high-duration technology and artificial intelligence infrastructure plays. The DAX 40 reveals European economic health through German industrial and export-driven manufacturing firms, making it a proxy for global trade sentiment.
Ready to Elevate Your Trading?
You have the information. Now, get the platform. Join thousands of successful traders who use Volity for its powerful tools, fast execution, and dedicated support.
Create Your Account in Under 3 MinutesBenefits of Trading Indices vs. Individual Stocks
Inherent diversification identifies the primary benefit of index trading, as it significantly reduces the impact of a single company’s bankruptcy or poor earnings on a total portfolio. When an investor holds all 500 S&P 500 constituents, a single firm’s 50% earnings miss represents just 0.2% portfolio impact, a minor fluctuation rather than a portfolio-threatening loss. This mathematical principle of diversification shows why index trading appeals to both conservative and aggressive traders seeking broad exposure.
Higher liquidity enables traders to enter and exit index positions even during market stress when individual stock trading becomes challenging. The S&P 500 ETF (SPY) typically trades 100+ million shares daily, allowing traders to buy or sell $1 million positions without moving the market. This execution certainty reveals why institutional investors with multi-billion dollar portfolios prefer index trading over attempting to acquire 500 individual stocks during periods of market turbulence.
Macro-focused strategies allow traders to express a view about “global economic growth” rather than attempting to predict whether a specific company will execute better than consensus expectations. Betting on the S&P 500 rising 5% identifies a trader’s belief that US corporate earnings will expand, leverage will remain accessible, and consumer demand will sustain. This broader perspective shifts focus from company-specific risks like management changes or product failures to macroeconomic themes like interest rates and profit margins.
Institutional funds have increased their allocation to passive index instruments by 15% in early 2026 as retail-driven individual stock volatility reached multi-year highs (Bloomberg Intelligence, 2026). This reallocation reveals that professional managers recognize index-based strategies provide better risk-adjusted returns during periods when individual stock dispersion widens due to Diversification benefits across hundreds of holdings.
How to Trade Indices: CFDs, ETFs, and Futures
Financial wrappers identify the specific vehicles, such as ETFs for long-term growth or CFDs for short-term speculation, that traders use to access index performance. Each wrapper delivers identical underlying index exposure but differs in leverage availability, tax treatment, and execution mechanics. Understanding these distinctions reveals which instrument best matches a trader’s time horizon and risk tolerance.
Index ETFs describe the “Buy and Hold” standard for retirement accounts and conservative long-term growth strategies. These exchange-traded funds provide direct ownership of all constituent stocks in exact index weighting proportions. An investor purchasing the Vanguard S&P 500 ETF (VOO) owns a fractional share of all 500 companies and receives dividend distributions automatically. ETFs charge minimal management fees of 0.03-0.10% annually, making them the lowest-cost approach for passive index exposure across decades of compounding growth.
Contracts for Difference (CFDs) identify leveraged derivatives allowing traders to speculate on index price movements without owning the underlying stocks. A trader with $1,000 can control a $20,000 S&P 500 position using 20:1 leverage under ESMA regulatory caps, amplifying both profits and losses proportionally. CFDs enable short-selling (profiting when indices decline), require no dividend distributions, and settle instantly without requiring custody arrangements. This flexibility reveals why CFDs appeal to short-term traders executing strategies based on technical analysis or macroeconomic catalysts.
Index Futures describe high-liquidity institutional contracts standardized by exchanges where buyers commit to purchasing an index at a predetermined future date. The E-mini S&P 500 futures contract, trading on the CME, represents $50 times the index value, meaning a $500,000 position requires only $25,000 margin. These instruments attract professional traders executing algorithmic trading strategies because futures markets operate 24 hours per day globally, unlike stock market hours-only trading.
Real trading example:
A trader identified an RSI oversold condition on the Nasdaq 100 (NDX) daily chart in February 2026 as the index touched its 200-day SMA support level near 20,800. The trader opened a 10:1 leveraged CFD position with $1,000 margin, controlling $10,000 notional exposure to NDX. Within three sessions, “Dip Buyers” re-entered the AI sector as earnings began stabilizing, pushing NDX higher by 5% to 21,840. The trader captured a $500 profit, a 50% return on the $1,000 margin deposit. Past performance is not indicative of future results.
Major Global Indices to Watch in 2026
Global index benchmarks identify the current price targets and sector weightings that define the 2026 investment landscape. Each index represents different economic exposures, from technology concentration in the Nasdaq to industrial cyclicality in the DAX, allowing traders to construct diversified multi-index strategies aligned with their macroeconomic views.
| Index Name | 2026 Key Pivot | Primary Sector | Target Multiple |
| S&P 500 (SPX) | 6,780 | Tech / Financials | 22.7x (Fwd) |
| Nasdaq (NDX) | 21,500 | AI / Semiconductor | 28.4x (Fwd) |
| Dow Jones (DJI) | 48,200 | Industrials / Healthcare | 18.5x (Fwd) |
| DAX 40 | 19,800 | Auto / Industrials | 14.2x (Fwd) |
| Nikkei 225 | 45,500 | Tech / Export | 16.8x (Fwd) |
Sources: Data compiled from S&P Global Research and Goldman Sachs 2026 Market Outlook Reports.
The S&P 500 currently approaches a critical resistance level at 6,780, marking the upper end of its current earnings-led valuation expansion in the “AI-First” economic cycle. Above this level, technical analysis reveals potential for a retest of the all-time highs, while a breakdown below 6,500 identifies support where institutional “dip buyers” have historically accumulated during corrections. This level reveals institutional concentration of limit buy orders that activate during 2-3% declines.
The Nasdaq 100 measures 28.4x forward earnings, reflecting market expectations that artificial intelligence infrastructure spending will drive 25%+ annual revenue growth in semiconductor and cloud companies. This valuation premium relative to the S&P 500’s 22.7x multiple identifies the market’s confidence in AI earnings expansion offsetting elevated valuations. If this earnings growth fails to materialize, the Nasdaq’s valuation multiple could compress 15-20%, representing 20% downside risk below current levels.
The DAX 40 reveals German manufacturing and export strength, benefiting from infrastructure modernization spending and energy cost normalization after 2022-2023 peak prices. At 14.2x forward earnings, the DAX trades at a 36% valuation discount to the S&P 500, suggesting institutional value allocators increasingly favor European industrials over US mega-cap technology. This divergence identifies a key 2026 rotation theme: from “AI Valuation Peak” toward “Real Economy Diversification.”
The S&P 500 index weighting shows that the top 10 constituents now represent 40% of total index value, a concentration level unseen since the Dot-Com era. This concentration reveals that index traders must monitor mega-cap technology earnings releases closely, as a single company’s earnings miss can cascade into 2-3% index declines within minutes.
The Impact of 0DTE Options on Index Volatility
Ultra-short-dated options identify the primary driver of 2026 intraday index volatility, as 0DTE (Zero Day) flows now account for 35% of total options volume. These contracts expire worthless or in-the-money within a single trading session, forcing market makers to hedge massive notional exposure through rapid buying or selling of the underlying index. This dynamic reveals why indices increasingly exhibit mechanical price patterns tied to options expiration rather than fundamental earnings revisions.
Gamma squeezes occur when option hedging forces market makers to become net buyers as prices rise toward strike prices, accelerating rallies beyond what fundamental analysis would justify. Conversely, if prices approach strike prices from below, market makers must sell, creating downward pressure even when earnings remain solid. This options-driven mechanics identifies that 2026 index traders must monitor the VIX and options skew charts to understand when mechanical flows will overpower earnings-based price discovery.
Intraday “pinning” occurs when indices stabilize at specific round numbers during final expiration hours as market makers minimize their gamma exposure. This reveals that a trader planning to hold an index position through 3:00 PM ET on a Friday expiration day should expect support or resistance at these technical levels where options expire worthless. Large blocks of option volume clustering at round numbers identify the probability that 0DTE hedging will defend those levels.
Risk management during 0DTE volatility requires wider stop-losses than normal trading conditions, as sudden $1,000+ swings in an index position can occur during the 15 minutes before market close. A trader using 10:1 leverage controlling $10,000 notional S&P 500 exposure experiences $50 profit/loss per one-point index move, meaning a typical 0DTE 30-point swing represents a $1,500 swing. This measurement identifies that Options Trading mechanics directly determine intraday index volatility patterns independent of economic news or earnings revisions.
Turn Knowledge into Profit
You have done the reading, now it is time to act. The best way to learn is by doing. Open a free, no-risk demo account and practice your strategy with virtual funds today.
Open a Free Demo AccountStep-by-Step: How to Place Your First Index Trade
Trading execution represents the final step in a structured index strategy, requiring precise platform selection and risk-per-trade rules. This process identifies the mechanics of converting an index thesis into an actual position with defined entry price, stop-loss level, and profit target. Each step reveals how professional traders systematize the decision process to avoid emotional errors.
Choosing a regulated broker confirms that your trading capital remains segregated from the brokerage’s operational funds, protecting your money if the firm fails. Regulatory bodies including the FCA (UK), ASIC (Australia), and CySEC (EU) maintain capital requirements and client money rules that reveal whether a broker has adequately capitalized to survive market shocks. A broker’s regulatory license displays immediately, if you cannot find a license number or cannot verify it on the regulator’s website, the firm likely operates as an unregistered offshore operation without client protections.
Sizing your trade using the 2% risk rule identifies that a trader should never risk more than 2% of total account capital on a single trade. A trader with a $10,000 account should risk maximum $200 per trade. If the trader places an S&P 500 position with a stop-loss 50 points away from entry, the leverage needed to achieve $200 risk is calculated as: (50 points × contract size) ÷ ($200 risk) = leverage. This mathematics reveals how stop-loss distance directly determines optimal position size and leverage.
Setting the invalidation level using technical support zones identifies the specific price where the original thesis breaks. If a trader believes the S&P 500 will rise from 6,600 based on the index touching its 200-day moving average, the invalidation level might be 6,550, the point where evidence of trend reversal becomes apparent. Placing stop-losses beyond round-number support levels avoids 0DTE option pinning that temporarily holds prices at obvious levels, which could stop out a correct trade prematurely.
What are Indices explains the foundational mechanics of index construction and weighting. Professional traders systematize their decision process by choosing the right instrument, sizing positions according to risk tolerance, and setting clear invalidation levels before entering any trade.
Key Takeaways
- [Index trading] identifies the performance of a group of stocks, providing a diversified way to speculate on broad market trends.
- [S&P 500] remains the global benchmark for 2026, currently trading at a premium forward multiple of 22.7x due to high earnings growth.
- [CFDs and ETFs] are the most common wrappers, with CFDs allowing for 20:1 leverage and ETFs serving as the “buy and hold” standard.
- [0DTE options] are a major driver of daily index volatility, accounting for over one-third of total options volume in the modern market.
- [Constituent weighting] is critical for traders to understand, as the top ten stocks often drive the majority of an index’s price movement.
- [Risk management] is essential when using leverage, requiring traders to set strict stop-losses to protect against rapid intraday reversals.
Frequently Asked Questions
This article contains references to index trading, the S&P 500, and Volity, a regulated CFD trading platform. This content is produced for educational purposes only and does not constitute financial advice or a recommendation to buy or sell any financial instrument. Always verify current regulatory status and platform details before using any trading service. Some links in this article may be affiliate links.