The gold silver ratio is the price of gold divided by the price of silver. It tells you how many ounces of silver one ounce of gold buys. On 10 November 2026, spot gold at $4,044.11 and silver at $51.79 gave a ratio of 78.1, so an ounce of gold was worth about 78 ounces of silver. This guide shows you how to calculate it, where that reading sits in more than 66 years of data, and how often the popular rule of buying silver when the ratio is high has worked.
TL;DR: The ratio is the price of one ounce of gold counted in ounces of silver. A high reading means silver is cheap next to gold, and a low one means it is dear. On World Bank monthly averages it has run from 16.4 (June 1968) to 111.5 (April 2020), with a middle value of 56.7. There is no fixed normal level: the median by decade ranged from 26.9 in the 1960s to 82.0 so far in the 2020s. Since 1971, months at 80 or above saw a lower ratio a year later only 58% of the time. Treat it as context. As a timing tool it is weak.
Every level below names its dataset and its date. Monthly averages smooth out the daily highs and lows, so different sites quote different records for the same year.
What the gold silver ratio measures
The ratio prices gold in silver instead of in money. Precious metals are quoted per troy ounce, the standard weight unit of the metals market. A spot price is the price for delivery now, the one most charts show.
Data sites often label the ratio XAU/XAG, after the currency-style codes for the two metals. The guide to what XAU means explains the gold code. MetalCharts, a commercial data site, showed 78.1 on 10 November 2026. The Vault Report, which uses futures prices, showed 78.2 the same day.
Read the number as a relative price. A high ratio means silver is cheap compared with gold. A low ratio means silver is expensive compared with gold. It says nothing about whether either metal is cheap in money terms. Between January and October 2026, World Bank monthly averages show gold down 13.6% and silver down 38.1%, and the ratio rose from 51.6 to 72.0. It rose because silver fell faster.
How to calculate it from two prices
The sum is one division. The care goes into picking two prices that match.
- Take a gold price and a silver price in the same currency. Most data is in US dollars.
- Check that both prices are per troy ounce. If one is quoted in another unit, convert it first.
- Use prices from the same moment or the same period, such as two closing prices from one day or two monthly averages.
- Divide the gold price by the silver price.
- Round to one decimal place and write the date and the source next to the result.
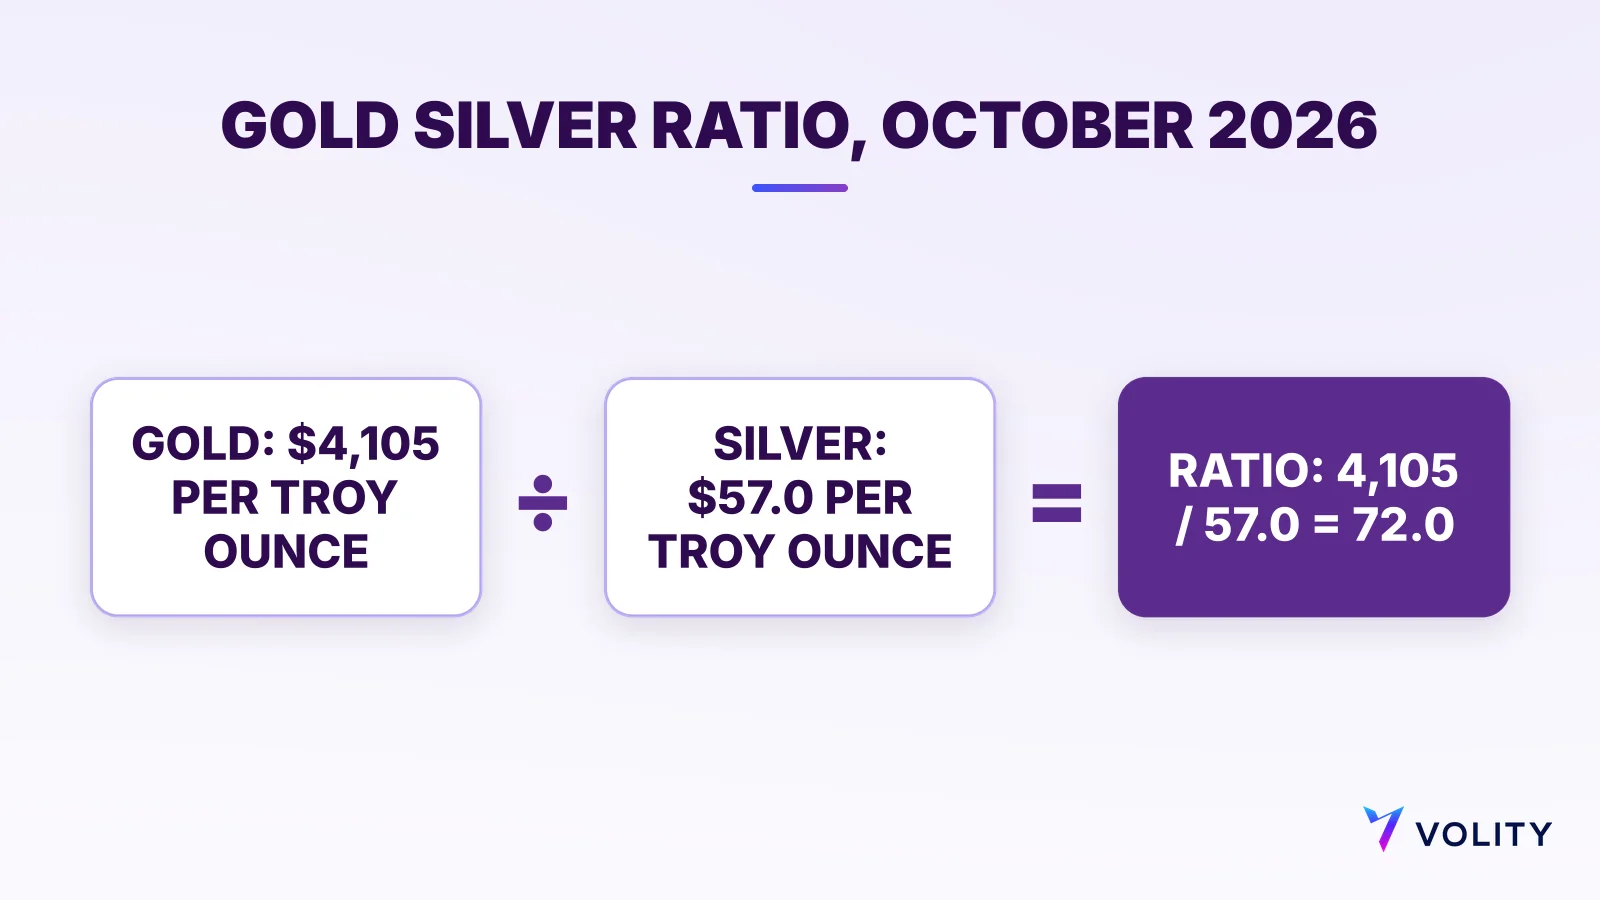
Here is a worked example with stable numbers. The World Bank monthly price file puts the October 2026 average at $4,105 for gold and $57.0 for silver. $4,105 / $57.0 = 72.0, so one ounce of gold matched 72 ounces of silver that month.
The price type and the timing both nudge the answer. Spot, futures and dealer coin prices differ slightly. A futures price is a price agreed today for delivery at a later date. The London benchmarks, the daily reference prices, are set at different times: gold at 10:30 and 15:00 London time and silver at 12:00, according to ICE Benchmark Administration. A ratio built from the two benchmarks mixes two moments of the day.
What high and low readings have meant in the past
The World Bank Commodity Markets series is free and holds 802 monthly averages, January 1960 to October 2026. Its middle month sits at 56.7. The lowest monthly average was 16.4 in June 1968. The highest was 111.5 in April 2020, when gold averaged $1,683 and silver $15.1. The Gold Barometer, which computes the same dataset, reports the same range.
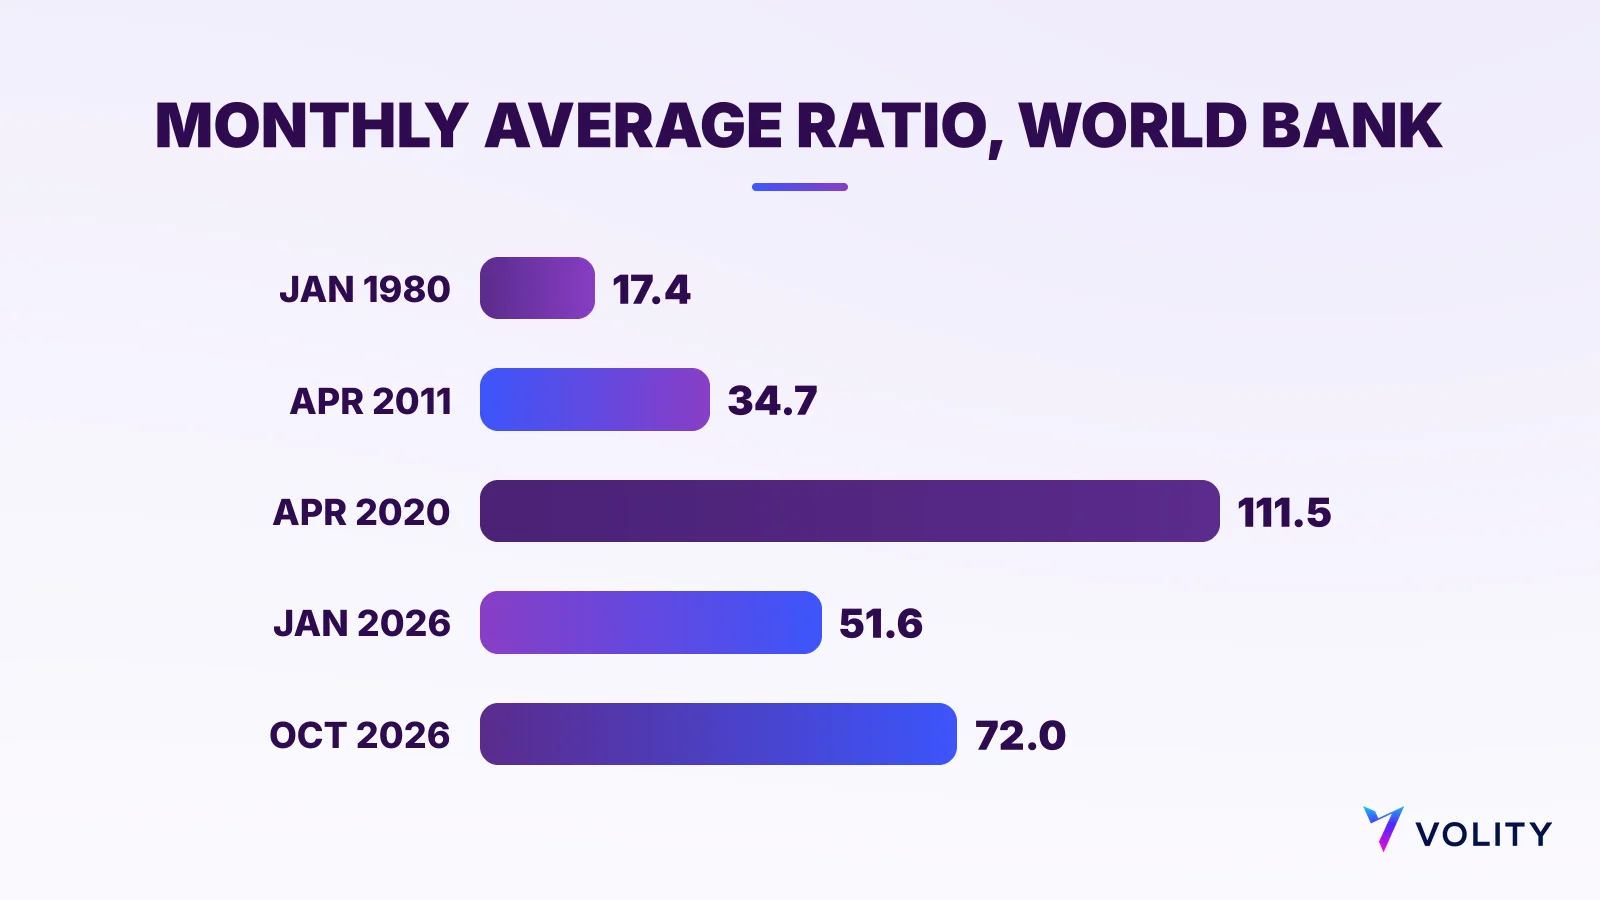
In January 1980 the monthly ratio fell to 17.4, with gold at $675 and silver at $38.9. In April 2011 it touched 34.7. No month from 1990 onward came lower. At the other end, it averaged 98.4 in February 1991.
The bigger lesson is that the ratio has no fixed home. Its typical level has drifted from decade to decade.
| Decade | Median monthly ratio |
|---|---|
| 1960s | 26.9 |
| 1970s | 32.4 |
| 1980s | 50.6 |
| 1990s | 73.9 |
| 2000s | 60.5 |
| 2010s | 68.9 |
| 2020s (to October 2026) | 82.0 |
The medians are calculated from the World Bank file, whose silver prices before 1976 come from a different series, so treat the early decades as a rough guide. A reading of 72 would have looked extreme in the 1970s and ordinary in the 1990s. High and low only mean something against a period you choose.
The last two years show how fast the ratio can travel. The Silver Institute’s World Silver Survey 2026 says it peaked at 107:1 in April 2025. It stayed above 85:1 until late September and fell below 55:1 in December, “its lowest since March 2013”. In January 2026 silver passed $100 for the first time and the ratio fell below 50, “a level last seen in 2012”, according to a Silver Institute release of 10 February 2026. On World Bank monthly averages, the same swing reads 100.9 in May 2025, 69.2 in December 2025, 51.6 in January 2026 and 72.0 in October 2026.
How traders use the ratio
The most common use is rotation between the metals. A holder switches from gold to silver when the ratio looks high, then back when it looks low. The aim is to end up with more ounces, whatever the money price does.
Say, as a hypothetical, you hold one ounce of gold and the ratio is 80. You swap it for 80 ounces of silver. If the ratio later falls to 50, those 80 ounces buy back 1.6 ounces of gold. If it rises to 100 instead, those 80 ounces buy back only 0.8 ounces of gold. Dealer spreads, the gap between buying and selling prices, cost you on every swap.
Traders who use CFDs can run the same idea as a pair trade. A CFD, or contract for difference, pays the change in a price without you owning the metal. You can go long, which gains if the price rises, or short, which gains if it falls. A pair trade buys one metal and sells the other, so the result depends mainly on how the two prices move against each other.
Take a hypothetical pair with each leg sized at $10,000 of exposure, meaning the full value of the position. You expect the ratio to fall, so you buy silver and sell gold. If silver rises 10% and gold rises 2%, the silver leg makes $1,000 and the gold leg loses $200, a net $800 before costs. If silver falls 10% and gold falls 2%, you lose a net $800 instead. Size the legs by money value. Matching ounces would make the gold leg about 78 times bigger at the 10 November reading, a bet on gold.
The ratio also reflects what drives each metal. Industrial uses took 657.4 million ounces of the 1,130.6 million ounces of silver demand in 2025, about 58%, per the World Silver Survey. Gold carries central-bank buying: central banks bought 321 tonnes in the third quarter of 2026, according to the World Gold Council’s Gold Demand Trends. From April 2020 to April 2021 the monthly ratio fell from 111.5 to 68.5, as silver rose 70% (from $15.1 to $25.7) and gold 4.6% (from $1,683 to $1,760). Read that in hindsight, with no claim that anyone could have timed the turn.
Many sites repeat a rule of thumb: buy silver when the ratio is above 80 and gold when it is below 50. The top-ranking pages that repeat it give no source for it, and the next section tests it. Ideas for each side are in the gold trading strategies guide and the silver trading overview.
What the ratio cannot tell you
It cannot tell you when. In the World Bank series from January 1971, the ratio averaged 80 or more in 107 months. Of the 106 with a reading a year later, it was lower in 62, or 58%, and the median change was a fall of just 2.5 points. That is better than a coin toss and far from a rule. Readings of 90 or more were rarer and more reliable: 20 months, lower a year later in 18, with a median fall of 11.7 points. The months overlap, so they are not 107 separate tests.
High readings can last for years. The monthly ratio was at or above 80 in all 12 months of 2019, all 12 of 2023 and 11 of 12 in 2025. Low readings stick too. Of 191 months at 50 or below since 1971, most fell between 1971 and 1985.
A second record points the same way. The Vault Report computes the ratio from Tanaka Kikinzoku’s Tokyo retail prices since 5 January 2005. On its count, a ratio of 80 or more (55 months) was lower a year later in 35 cases. The site adds: “It is not a forecast”.
The two metals also answer to different forces. Only 26% of the silver mined in 2025 came from mines where silver is the main product, a record low, per the World Silver Survey. The US Geological Survey says silver is “primarily obtained as a byproduct from lead-zinc, copper, and gold mines”. So silver supply follows decisions about other metals, and no law pulls the ratio back to an average. The case for the metal itself is in is silver a good investment.
A pair trade also doubles the moving parts. Each leg has its own spread, and each leg held past 22:00 GMT may pay or receive its own overnight amount. Check both on the charges and fees page before you size a trade. Leverage lets a small deposit, called margin, control a larger position, and it magnifies losses on both legs. The legs can also lose together: if silver falls while gold rises, a long silver and short gold trade loses on both sides.
Regulators are blunt about the product. “CFDs are complex, high-risk products,” said Mark Francis, the FCA’s director of sell-side markets, in an October 2025 warning. Its CFD page calls them high-risk products “which are not suitable for all retail consumers”. At Australia’s regulator ASIC, Commissioner Alan Kirkland said in October 2026 that its data “repeatedly shows that most retail investors lose money trading CFDs”.
Trade gold and silver from one account
Gold and silver both trade 24/7 on Volity, and forex trades 24/5. Spot gold is traded as a CFD, XAU/USD and XAU/EUR, long or short, from the same account that holds forex, indices, commodities and crypto. Silver sits in the same account. The gold trading platform guide covers the tools.
Leverage on metals goes up to 1:500. It magnifies losses as well as gains, so size each leg for the loss you can accept. Spreads are dynamic, and the live spread for each instrument is shown on the platform. The Markets account is commission-free.
A free demo is available on every account tier. It lets you watch the ratio move in live prices without risking money:
- Open a demo and add gold and silver to one watchlist.
- Divide the gold price by the silver price at the same moment and note the time.
- Repeat at the same hour for a few weeks to see how far the ratio moves.
- If you test a pair trade, size both legs to the same money value and write the plan down first.
- Set a stop-loss on each leg. A stop-loss is an order that closes a position at a price you choose.
- Check each leg’s spread and overnight amount before you hold past 22:00 GMT.
The gold hub has more guides on the gold side of the ratio.
Fact check: Historical ratios are calculated from the World Bank Commodity Markets monthly price file (US dollars per troy ounce, January 1960 to October 2026, updated 3 November 2026) and cross-checked against The Gold Barometer. Figures for 2025 and 2026 come from the Silver Institute, the World Gold Council and the USGS. Benchmark times from ICE Benchmark Administration, risk wording from the FCA and ASIC, live readings from MetalCharts and The Vault Report. Sources checked 10 November 2026.
Frequently asked questions
What is a good gold silver ratio?
There is no single good level. The World Bank monthly series has a middle value of 56.7 since 1960 and 63.2 since 1971. The decade median ranged from 26.9 in the 1960s to 82.0 so far in the 2020s. Judge a reading against a period you choose, and say which one.
What does a high gold silver ratio mean?
It means silver is cheap compared with gold, so one ounce of gold buys many ounces of silver. It is no promise that silver will catch up soon. The monthly ratio stayed at 80 or more through all of 2019 and all of 2023.
How do you calculate the gold silver ratio?
Divide the gold price by the silver price, both in the same currency, per troy ounce and from the same moment. With World Bank October 2026 averages, $4,105 / $57.0 = 72.0.
Is the gold silver ratio a reliable signal?
Not on its own. Since 1971, months with the ratio at 80 or more were followed by a lower ratio a year later 58% of the time, with a median fall of only 2.5 points. Readings of 90 or more did better, but there were only 20 such months.
What was the highest gold silver ratio?
It depends on the dataset. The highest World Bank monthly average was 111.5 in April 2020. For 2025, the Silver Institute reports a peak of 107:1 in April, and The Vault Report’s daily futures data shows 104.8 on 21 April 2025.
Can you trade the gold silver ratio with CFDs?
Yes, through two separate positions: long one metal and short the other, each sized to the same money value. Each leg carries its own spread, overnight amount and leverage risk, and the legs can lose at the same time. A demo lets you practise the sizing first.