Wirtschaftsdatenveröffentlichungen wie CPI und PPI verursachen extreme Marktvolatilität und erhebliche Slippage. Anfängliche Preisreaktionen sind oft übertrieben und können sich innerhalb von Minuten scharf umkehren. Traden Sie Nachrichten mit hoher Wirkung niemals ohne einen klaren Risikomanagementplan und passende Stop-Loss-Orders. Vergangene Wertentwicklung ist kein Hinweis auf künftige Ergebnisse. Kapital ist Risiken ausgesetzt.
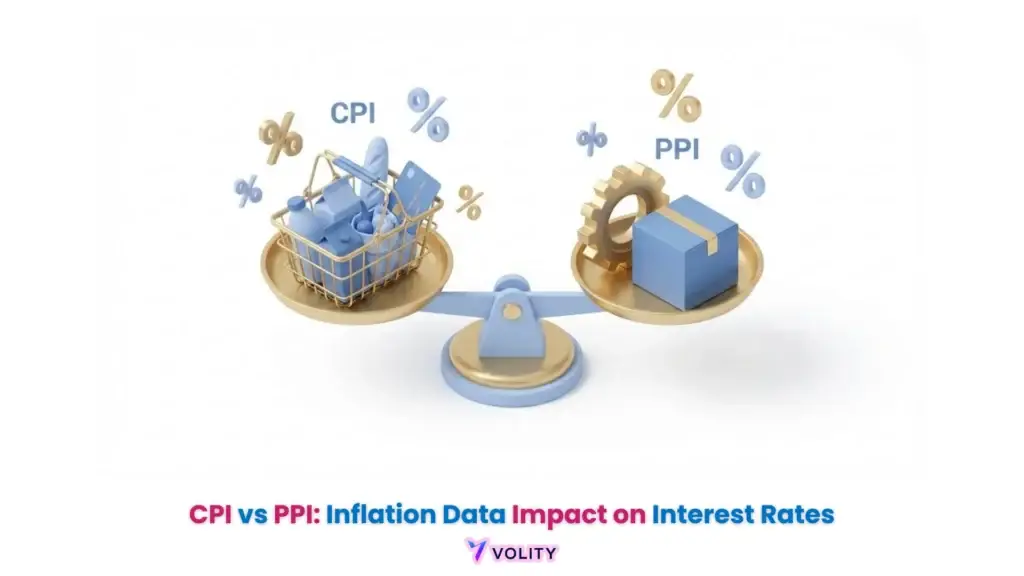
CPI und PPI bezeichnen die wichtigsten Inflationsmaße und verfolgen Preisänderungen auf Verbraucher- bzw. Erzeugerebene. Diese Indikatoren zeigen einen scharfen Anstieg der US-Inflation auf 3,3 % im April 2026, getrieben von Energiekosten. Die führende Natur des PPI zu erkennen erlaubt Forex-Tradern, Zinsänderungen der Zentralbanken zu antizipieren und sich für große USD-Volatilität zu positionieren.
CPI (Verbraucherpreisindex) und PPI (Erzeugerpreisindex) bezeichnen die beiden Triebkräfte der Inflationsdaten, die die globalen Währungsbewertungen antreiben. Diese Berichte zeigen einen erheblichen Anstieg der US-Verbraucherpreise um 3,3 % im Jahresvergleich per April 2026, die stärkste monatliche Beschleunigung seit der Energiekrise 2022. Indem sie Preisänderungen sowohl aus Sicht des Käufers als auch des Verkäufers messen, liefern diese Indizes die grundlegenden Belege, die für die Zinsentscheidungen der Zentralbanken erforderlich sind.
Die Forex-Landschaft 2026 ist von erhöhter Empfindlichkeit gegenüber energiebedingten Inflationsschocks nach geopolitischen Eskalationen im Nahen Osten geprägt. Da der Erzeugerpreisindex als „Schnellkochtopf“ der breiteren Wirtschaft wirkt, ist das Verständnis seines Durchschlageffekts auf die Verbraucher-Einzelhandelspreise die wichtigste Fähigkeit für Fundamentalanalysten. Dieser Leitfaden identifiziert die strukturellen Unterschiede zwischen CPI und PPI und zeigt die strategischen Maßstäbe für das Traden ihrer Veröffentlichungen mit hoher Wirkung.
Das Verständnis von CPI and PPI Data ist wichtig, doch echtes Wachstum entsteht erst durch die Anwendung dieses Wissens. Kostenloses Forex-Handelskonto erstellen, um mit einem kostenlosen Demokonto zu üben und Ihre Strategie zu testen.
Warum treiben Inflationsdaten 2026 die Forex-Märkte an?
Inflationsdaten sind der wichtigste Katalysator der Geldpolitik der Zentralbanken, wobei steigende Preise einen Bedarf an höheren Zinsen anzeigen, um die Kaufkraft der heimischen Währung zu erhalten. Die Verbindung zur Kaufkraft erklärt, warum Trader 2026 Inflation als die „Erosion“ des Währungswerts betrachten, die höhere Renditen erfordert, um den Rückgang der realen Kaufkraft auszugleichen. Die Maßstäbe der Politik der Federal Reserve zeigen, dass das Inflationsziel von 2 % Anfang 2026 der „Heilige Gral“ der Federal Reserve bleibt.
Die Zinserwartungen verschieben sich drastisch je nach Inflationsüberraschungen; ein Übertreffen der Prognose um 0,1 % beim Core CPI löst oft Erwartungen von Zinserhöhungen um 25 bis 50 Basispunkte aus. Kapitalflüsse reagieren sofort; höhere Inflationsdaten stärken häufig den USD, da Anleger die Sicherheit höher verzinster US-Staatsanleihen suchen. US-Dollar-Index (DXY): Prognose 2026 verfolgt, wie sich Inflationsdaten in der gesamten Weltwirtschaft in Währungsstärke übersetzen.
Bereit, Ihr Trading auf das nächste Level zu bringen?
Sie haben das Wissen. Jetzt fehlt die Plattform. Schließen Sie sich Tausenden erfolgreichen Tradern an, die Volity für leistungsstarke Tools, schnelle Ausführung und engagierten Support nutzen.
Erstellen Sie Ihr Konto in unter 3 MinutenFührende vs. nachlaufende Signale: der Durchschlag von PPI auf CPI
Die Beziehung zwischen CPI und PPI gleicht einer Lieferketten-Pipeline, in der der Erzeugerpreisindex frühe Kostendrücke aufzeigt, die nachweislich in den Folgemonaten die Verbraucher erreichen. Die „Schnellkochtopf“-Analogie erklärt, wie der PPI die „Hitze“ in den Rohren und der CPI das finale „Pfeifen“ der Inflation ist; ein steigender PPI signalisiert künftige Verbraucherpreise. Die Lieferkettenübertragung zeigt, wie der Sprung von 8,5 % bei den Energiematerialien 2026 (Diesel/Fracht) innerhalb von Wochen in die Lebensmittelpreise einsickert.
Divergenzrisiken bezeichnen Szenarien, in denen der CPI flach bleibt, während der PPI steigt, was eine künftige Kompression der Gewinnmargen der Unternehmen signalisiert; Unternehmen absorbieren Kosten, statt sie sofort weiterzugeben. Erkenntnisse zum Core PPI zeigen, wie wichtig es ist, volatile Lebensmittel- und Energiepreise auszuschließen; diese „klebrige“ Inflation fürchten Zentralbanken am meisten. Technische vs. fundamentale Analyse: Was ist besser? erklärt, wie Trader Fundamentaldaten in technische Einstiegsstrategien einbauen.
Beobachten Sie die Komponente „Fertigwaren“ des PPI. 2026 ist sie das zuverlässigste Signal für den Headline-CPI des nächsten Monats, da diese Kosten fast immer innerhalb von 30 Tagen direkt an die Verbraucher weitergegeben werden.
US-Inflationsanalyse April 2026
Die US-Inflationsdaten von April 2026 zeigen eine direkte Korrelation zwischen dem geopolitischen Konflikt im Nahen Osten und dem monatlichen Sprung der heimischen Benzinpreise um 21,2 %. Geopolitische Treiber zeigen, wie die Eskalation zwischen Iran und Israel das Benzin im März/April 2026 über die Marke von 4,00 $/Gallone trieb. Die 75-Prozent-Regel identifiziert, wie Benzin allein den Großteil des Anstiegs des Headline-CPI im April ausmachte.
Das Verbrauchervertrauen erlitt während der Krise einen Schock; die Umfrage der University of Michigan erreichte im April 2026 ein 76-Jahres-Tief und spiegelte tiefe Sorge über Energiekosten und künftige Kaufkraft wider. Die Sektorperformance zeigt, dass die Wohnkosten weiter nachließen (3,0 % im Jahresvergleich), während Energiematerialien ein 4-Jahres-Hoch erreichten. Forex-Wirtschaftskalender: wie man Nachrichten tradet liefert den Zeitplan künftiger Inflationsveröffentlichungen und ihre historische Marktwirkung.
💡 KERNERKENNTNIS: Der Energieschock 2026 (Benzin +21,2 %) hat den Headline-CPI volatiler gemacht als den Core. Das identifiziert ein einzigartiges Szenario, in dem die Federal Reserve die Gesamtspitze ignorieren und sich auf den stabilen monatlichen Core-Wert von 0,2 % konzentrieren könnte.
US-Inflationsentwicklung 2026 und Marktmaßstäbe
Inflationsmaßstäbe zeigen die historische Volatilität und den Trend stabiler Dienstleistungen, der in der US-Wirtschaft im zweiten Quartal 2026 beobachtet wurde.
| Indextyp | Jährliche Änderung (J/J) | Monatliche Änderung (M/M) |
| Headline-CPI | 3,3 % (April 2026) | +0,9 % (Anstieg) |
| Core CPI | 2,6 % (April 2026) | +0,2 % (moderat) |
| PPI Endnachfrage | 4,0 % (April 2026) | +0,5 % (Prognose 1,1 %) |
| PPI Energie | +8,5 % (April 2026) | Diesel +42,0 % |
| PPI Dienstleistungen | 0,0 % (unverändert) | Lohnwachstum stabil |
Quellen: BLS-Veröffentlichungen April 2026, technische Zusammenfassungen von Trading Economics
Wissen in Gewinn verwandeln
Sie haben gelesen, jetzt ist es Zeit zu handeln. Der beste Weg zu lernen ist durch Praxis. Eröffnen Sie ein kostenloses, risikofreies Demokonto und üben Sie Ihre Strategie noch heute mit virtuellem Guthaben.
Kostenloses Demokonto eröffnenTrading-Strategien
Inflationsveröffentlichungen zu traden ist eine Strategie hoher Volatilität, die den Vergleich der „Ist“-Daten mit dem „Prognose“-Konsens erfordert, um profitable Markteinstiege auszuführen. Die Abweichungsregel zeigt, dass eine Überraschung von 0,1 % beim Core CPI den Markt oft stärker bewegt als ein erwarteter Schritt von 1,0 % beim Headline; der Markt kümmert sich um Überraschungen, nicht um die Größenordnung. Das Faden der Spitze identifiziert die psychologische Überreaktion auf die anfänglichen Daten und die Positionierung für die 30-Minuten-Rückkehr zum Mittelwert, wenn das Smart Money Gewinne mitnimmt.
SMC-Konzepte nutzen „Fair Value Gaps“ und „Liquiditätssweeps“, um zu erkennen, wo institutionelle Bots ihre Orders platzieren. Die Wahl des Zeitrahmens zeigt M5- und M15-Charts als bevorzugte Fenster für die Ausführung bei Inflationsveröffentlichungen, die den Whipsaw einfangen, bevor sich längerfristige Trends etablieren. Die 10 besten Forex-Trading-Strategien für 2026 erkundet systematische Ansätze für das Trading von Nachrichten und die Fundamentalanalyse.
WARNUNG: Vermeiden Sie es, der anfänglichen „Spitze“ um 8:30 Uhr ET hinterherzulaufen. 2026 führt das institutionelle „Smart Money“ häufig Liquiditätssweeps in den ersten 60 Sekunden aus, was Retail-Tradern abverlangt, auf den Schluss der 5-Minuten-Kerze zu warten.
Zentralbankpolitik
Die Zentralbankpolitik bezeichnet das Inflationsziel von 2 % als die primäre Entscheidungsschwelle für die Bestimmung des Zeitpunkts der Zinssenkungen 2026. Die verzögerte Lockerung zeigt, warum die Headline-Spitze von April 2026 die Fed gezwungen hat, Zinssenkungen von Juni auf das späte vierte Quartal zu verschieben. Reale Zinsen zeigen, wie das Abziehen der Inflation vom Nominalzins die wahre „Straffheit“ der Geldpolitik identifiziert.
Die Sorgen über lohngetriebene Inflation lassen leicht nach, da der unveränderte PPI der Dienstleistungen von 0,0 % den „Silberstreif“ im Kampf der Federal Reserve gegen die Stagflation aufzeigt. Die globale Rotation reagiert auf US-Inflationsdaten; höhere Zinsen stärken den USD über die Theorie des „Dollar-Lächelns“ und begünstigen Carry-Trades in Schwellenmarktwerte. Zinstrading im Forex: ein vollständiger Leitfaden erklärt, wie man von Zinserwartungen und politischen Wendungen der Zentralbanken profitiert.
US Bureau of Labor Statistics: Zusammenfassung des Verbraucherpreisindex liefert die offizielle Quelle für CPI-Daten und eine detaillierte Methodik.
Trading Economics: Zusammenfassung der US-Inflationsrate, April 2026 verfolgt CPI/PPI-Statistiken und Prognosen in Echtzeit.
ECB Economic Bulletin Warum der PPI ein Frühindikator für den CPI ist erklärt die theoretische Grundlage des Durchschlageffekts.
Wichtige Erkenntnisse
- Der CPI (Verbraucherpreisindex) bezeichnet die Lebenshaltungskosten auf Einzelhandelsebene und dient der Federal Reserve als primärer Indikator für Zinsanpassungen.
- Der PPI (Erzeugerpreisindex) bezeichnet Großhandelspreisänderungen und wirkt nachweislich als Frühindikator für die Verbraucherinflation drei bis sechs Monate im Voraus.
- Der US-Headline-CPI stieg im April 2026 auf 3,3 %, getrieben von einem erheblichen monatlichen Sprung der Energiekosten um 10,9 % nach Eskalationen im Nahen Osten.
- Die Core-Inflation (ohne Lebensmittel und Energie) bezeichnet den zugrunde liegenden Trend, der Anfang 2026 mit 2,6 % im Jahresvergleich relativ stabil blieb.
- Die Volatilität des Forex-Marktes bezeichnet die Abweichung „Ist vs. Prognose“ als den wichtigsten Treiber schneller USD-Preisbewegungen während Datenveröffentlichungen.
- Die Erwartungen von Zinssenkungen der Zentralbanken 2026 wurden aufgrund anhaltender energiegetriebener Spitzen der Headline-Inflation ins vierte Quartal verschoben.
Häufig gestellte Fragen
Dieser Artikel verweist auf die Wirtschaftsindikatoren CPI und PPI, die US-Geldpolitik und Forex-Trading-Strategien und erwähnt Volity, eine regulierte CFD-Trading-Plattform. Dieser Inhalt wird ausschließlich zu Bildungszwecken erstellt und stellt weder eine Finanzberatung noch eine Empfehlung dar, ein Währungspaar oder ein Finanzinstrument zu traden. Das Traden von Wirtschaftsdaten ist von Natur aus riskant und scharfen Umkehrungen ausgesetzt. Nutzen Sie beim Traden von Wirtschaftsveröffentlichungen stets passende Stop-Loss-Orders und Risikomanagement. Einige Links in diesem Artikel können Affiliate-Links sein.
Worauf unsere Analysten achten: Die Positionierung auf Inflationsdaten belohnt Trader, die die strukturelle Aufschlüsselung statt der Headline-Zahl lesen, und drei Lesarten bündeln das Signal. Der Core CPI der Dienstleistungen ohne Wohnen, oft Supercore genannt, der das von der Fed bevorzugte Maß des zugrunde liegenden inländischen Inflationsdrucks ist und das, was die dauerhaften Fed-Politik-Erwartungen antreibt. Der PPI der Endnachfrage-Dienstleistungen, der die Dienstleistungskomponente des CPI typischerweise um ein Quartal anführt und eine frühe Warnung vor kommenden CPI-Überraschungen liefert. Die komponentenübergreifende Kohärenz zwischen CPI und PPI bei der Güterinflation, wo eine Divergenz (steigender Güter-CPI bei fallendem Güter-PPI oder umgekehrt) eine Margenkompression oder -ausweitung auf der Einzelhandelsebene signalisiert, die die Positionierung bei Aktien und Unternehmensanleihen neben dem Forex beeinflusst. Die Forex-Reaktion auf Inflationsüberraschungen ist über die jüngsten Zyklen von der Headline-Zahl zur Komponentenaufschlüsselung gewandert, weshalb die institutionellen Desks die vollständige Veröffentlichung statt des Oberflächenwerts lesen. Der Volity-Desk verfolgt die Positionierung auf Inflationsdaten unter CySEC-186/12-Aufsicht über UBK Markets mit Entitäten in St. Lucia, Zypern und Hongkong.
Volity betreibt eine Handelsplattform und veröffentlicht außerdem Bildungs- und Analyseinhalte zum Thema Trading. Die Inhalte dieser Seite dienen ausschließlich Bildungszwecken und sind nicht als Finanzberatung zu verstehen. Volity kann kommerziell profitieren, wenn Leser über Links auf dieser Website Handelskonten eröffnen.
Unsere Inhalte werden nach dokumentierten redaktionellen Standards erstellt und geprüft; siehe unsere Vergleichs- und Bewertungsmethodik.