The Bear Flag pattern is a bearish continuation pattern that signals the likely resumption of an existing downtrend. It frequently appears in financial markets, providing traders with an opportunity to capitalize on downward price movements. Understanding its structure and statistical tendencies is crucial for effective trading.
While understanding Bear Flag Pattern is important, applying that knowledge is where the real growth happens. Create Your Free Forex Trading Account to practice with a free demo account and put your strategy to the test.
What is a Bear Flag Pattern?
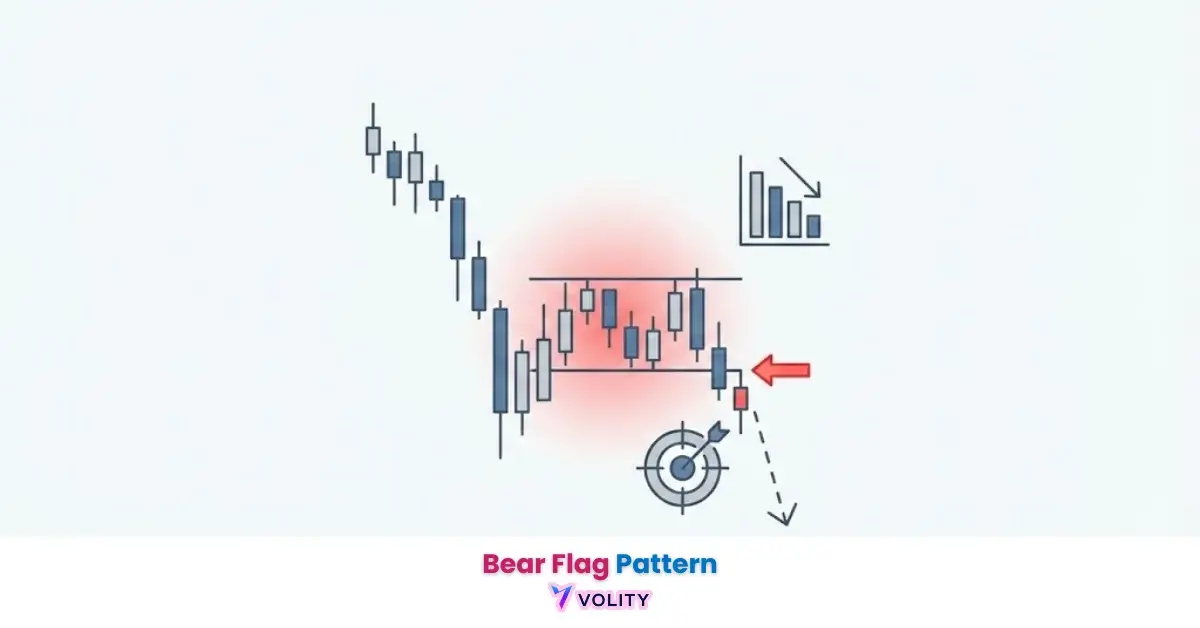
The Bear Flag is a bearish continuation pattern characterized by a sharp decline, known as the flag pole. This initial drop is followed by a brief period of price consolidation forming a rectangular or slightly upward-sloping channel, defined by trend lines. The pattern culminates in a breakout to the downside, signaling that the prevailing downtrend is likely to resume. This structure indicates a temporary pause in selling pressure before the dominant trend continues.
How to Identify a Bear Flag Pattern?
Now that we have defined the pattern, we must deconstruct its visual components to correctly identify it on a chart. Correct identification prevents misinterpretation and improves trading accuracy.
- The Flag Pole: This represents an impulsive trend wave, typically a sharp and significant drop in price. High volume often accompanies this initial decline, indicating strong selling pressure. The length of the flag pole is crucial for calculating potential profit targets.
- The Flag (Consolidation): The flag forms as a counter-trend retracement, appearing as a narrow channel. It is defined by two parallel trend lines, often sloping slightly upwards. During this phase, price action consolidates within a confined range.
- Volume Profile: Volume provides critical confirmation. It generally decreases during the flag’s consolidation phase, reflecting reduced selling or buying interest. A significant spike in volume then occurs during the breakout from the flag.
- The Breakout: This is the decisive moment when price closes below the lower support line of the flag’s channel. This confirms the bearish continuation and signals the resumption of the original downtrend.
Ready to Elevate Your Trading?
You have the information. Now, get the platform. Join thousands of successful traders who use Volity for its powerful tools, fast execution, and dedicated support.
Create Your Account in Under 3 MinutesBear Flag vs. Bull Flag
Visual identification is critical, but traders often confuse this pattern with its bullish counterpart. Understanding the distinct characteristics of each helps prevent costly errors.
| Feature | Bear Flag | Bull Flag |
| Trend Context | Occurs within a downtrend | Occurs within an uptrend |
| Shape | Inverted “F” shape; upward-sloping flag | “F” shape; downward-sloping flag |
| Breakout Direction | Downside continuation | Upside continuation |
| Volume Behavior | High on initial drop, low on flag | High on initial rally, low on flag |
Reliability & Backtesting Results
Recognizing the pattern is only step one; knowing its statistical reliability determines if it is worth trading. While no pattern guarantees success, historical performance provides valuable insights.
Research suggests that bearish continuation patterns, including the bear flag, possess a notable win rate across various financial markets. Many professional traders observe that the bear flag typically resolves downward, confirming the initial downtrend.
The statistical probability of this downside resolution increases significantly when accompanied by appropriate volume confirmation. During the consolidation phase, decreasing volume indicates a lack of buying interest to reverse the prior move.
A surge in volume on the breakout candle reinforces the validity of the signal. Market sentiment, particularly during periods of overall weakness, often enhances the pattern’s effectiveness.
How to Trade the Bear Flag Strategy?
With the statistics validating the setup, we move to the step-by-step execution of the trade. A systematic approach ensures consistent application and improved outcomes.
- Step 1: Identify a strong downtrend characterized by lower lows and lower highs. Then, observe the formation of the flag pole, which is a sharp, impulsive downward move.
- Step 2: Wait for the price consolidation to fully form within the flag channel. The price should respect both the upper resistance trend line and the lower support trend line.
- Step 3: For aggressive traders, an entry near the top of the flag, anticipating the downside, is possible. Conservative traders wait for a confirmed breakout below the lower channel trend line before initiating a short position.
- Step 4: Verify volume expansion on the breakdown candle. A significant increase in selling volume confirms the validity of the breakout and strengthens the bearish signal.
Risk Management: Stop Loss & Profit Targets
Entering the trade is the easy part; managing the position via stops and targets is where profitability is defined. Proper risk management protects capital and optimizes returns.
- Stop Loss Placement: Place the stop loss order slightly above the upper trend line of the flag’s consolidation channel. Alternatively, positioning it just above the most recent swing high within the flag invalidates the setup if the price moves against the anticipated direction.
- Measured Move (Target): Calculate the length of the flag pole from its high to its low. Project this exact distance downward from the breakout point (the low of the breakout candle). This projection provides a primary profit target.
- Risk/Reward Ratio: Before entering any trade, ensure the setup offers an attractive risk/reward ratio. A minimum 1:2 risk-to-reward ratio is often recommended, meaning the potential profit is at least double the potential loss.
Advanced Bear Flag Trading Strategies: MA Pullbacks & Retests
Standard strategies work, but advanced traders utilize additional indicators and retests to filter false signals. These techniques enhance conviction and trade accuracy.
The Moving Average Pullback strategy involves entering a short position when the flag’s consolidation taps into a key moving average (MA). For example, if the price pulls back to the 20 or 50-period MA within the flag and then breaks down, it provides an additional layer of confirmation. Another powerful technique is the Break and Retest mechanic. This occurs when the price breaks below the lower trend line of the flag, then subsequently rallies back to test that broken trend line. The previously established support line now acts as Support turned Resistance. A rejection from this retested level, often with low volume on the retest and renewed selling volume, strongly confirms the breakout and presents a high-probability entry point. These Retest Mechanics often provide a safer entry with a tighter stop-loss.
Pros, Cons, and Failure Cases of Bear Flag Patterns
Even with advanced strategies, the pattern has limitations and specific failure scenarios traders must avoid. Awareness of these factors improves overall trading performance.
| Factor | Description |
| Pros | Offers high potential Risk/Reward Ratio due to clear entry, stop, and target levels. Provides clear invalidation levels, making risk management straightforward. Signals a continuation of the dominant trend. |
| Cons | Susceptible to false breakouts, often called a “bear trap,” where price breaks down only to reverse sharply. Can suffer from trend exhaustion, where the initial momentum of the flag pole dissipates. |
| Failure Signs | Decreasing volume on the breakout candle, rather than increasing. Price closing back inside the flag’s channel after an initial breakout. The price action failing to reach its measured move target. |
Key Takeaways
- The Bear Flag is a bearish continuation pattern signaling a likely resumption of the downtrend.
- Crucial components include the flag pole, price consolidation, and the breakout point.
- Volume profile acts as a key confirmation signal, with decreasing volume in the flag and increasing volume on the breakout.
- Effective trading involves setting precise stop losses (above the flag) and profit targets (using the measured move).
- Advanced strategies like moving average pullbacks and break and retest scenarios enhance trading accuracy.
BOTTOM LINE
The Bear Flag pattern serves as a potent indicator for traders looking to identify and capitalize on sustained downward trends. Its clear structural components—a sharp flag pole followed by price consolidation—offer precise entry, stop-loss, and profit target levels.
While its statistical probability for bearish continuation is generally high, rigorous adherence to volume profile confirmation and strict risk management, including calculated measured moves, is paramount.
Traders who master its identification and application, even incorporating advanced strategies like moving average pullbacks and break and retest mechanics, significantly enhance their ability to navigate volatile markets effectively.
Turn Knowledge into Profit
You've done the reading, now it's time to act. The best way to learn is by doing. Open a free, no-risk demo account and practice your strategy with virtual funds today.
Open a Free Demo Account