Investing in financial products involves risk. Losses may exceed the value of your original investment.
Bitcoin ethereum risk is a core topic for traders in 2026. The complete guide follows.
Crypto markets rally as Iran risk meets protocol upgrades
Crypto caught a bid on Tuesday, even as traders watched a widening US-Iran standoff and a jump in oil. Bitcoin held the line near $70,000, while Ethereum finally pushed cleanly out of a long down channel. Meanwhile, the tone improved on Capitol Hill and in corporate treasuries, which helped the rally feel less like a reflex bounce.
However, the price action still looked jumpy. Traders kept one eye on inflation risk from crude above $103 a barrel. They kept the other on technical levels that have squandered more breakouts than they have rewarded.
Bitcoin stalks a breakout, but sentiment stays sour
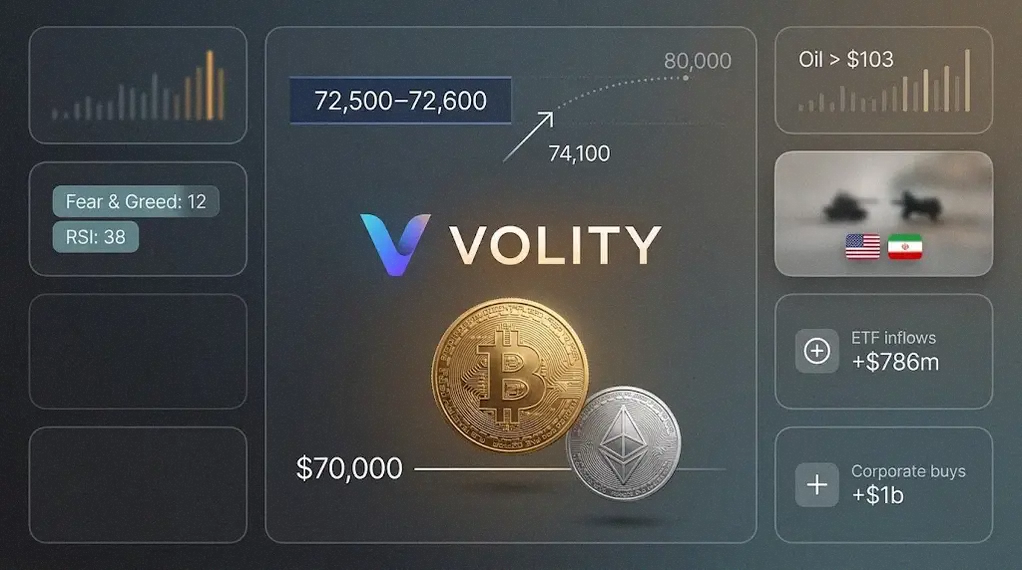
Bitcoin hovered around the top of an ascending triangle and pressed resistance near $72,500 to $72,600. Therefore, chart traders focused on a clean push above $74,100, which would open the way to the mid-$70,000s and a retest of $80,000.
Yet the mood remained defensive. The Fear and Greed Index printed 12, while RSI sat near 38, close to oversold. Meanwhile, the broader crypto market capitalisation stood near $2.49 trillion, down about 0.8% over 24 hours, which undercut the cheer.
Support did not look theoretical. Buyers defended $69,800, with $68,450 around the 200-day moving average. In addition, traders cited $68,200 near a 0.618 Fibonacci level as the next stop if $70,000 breaks with force.
Still, institutions supplied some ballast. MicroStrategy’s latest $1 billion purchase, 13,927 bitcoin, kept its accumulation story rolling. Meanwhile, spot bitcoin ETFs took in roughly $786 million last week, which hinted that allocators still buy dips when they feel paid to wait.
Ethereum leads, while altcoins chase
Ethereum outperformed after breaking out of a multi-year descending channel. Consequently, technicians pointed to $3,400 as a plausible upside target if the breakout holds through the next pullback.
Elsewhere, the tape looked mixed rather than manic. Chainlink tightened into a coiling pattern that traders often treat as a volatility spring. Hyperliquid approached a familiar ceiling near $46, which could either cap momentum or, if cleared, trigger a wave of stop-driven buying.
Meanwhile, protocol headlines did their usual job of creating pockets of heat. Pi Network’s major upgrade helped sentiment in its corner of the market, although liquidity and follow-through will matter more than announcements by the end of the week.
Rules, risks and the Washington drumbeat
In Washington, the Clarity Act inched forward towards a Senate markup, while stablecoin talk kept bleeding into broader market structure debates. Therefore, traders treated the regulatory news as a slow-moving tailwind rather than a tradable catalyst.
However, warnings landed too. The American Bankers Association flagged interest-bearing stablecoins as a potential threat to deposits, with a cited risk of up to $6.6 trillion in flight. Abroad, the UK moved towards a 2026 rulebook, with a carve-out approach for parts of DeFi, which suggested a more segmented regime.
Enforcement remained active. The US Justice Department opened a $40 million fund for OneCoin victims, while South Korea fined Coinone about $3.5 million over AML failures. Consequently, the compliance premium for reputable venues should persist.
Geopolitics hits crude, then spills into crypto
Geopolitics did not fade into the background. Oil traded above $103 a barrel after Donald Trump’s Iran blockade comments, which fed inflation chatter and threatened risk assets. Meanwhile, traders linked any sustained crude spike to rate-cut delays, which tends to pinch crypto via tighter financial conditions.
Bitcoin’s $70,000 zone became the market’s mood ring. If it holds, dip buyers can argue that crypto has learned to live with headlines. If it cracks, the next bids may sit closer to the high-$60,000s, where longer-term moving averages wait.
Company moves and weird corners of the tape
Corporate and partnership headlines provided colour, if not always clear valuation impact. Nexo signed on as a digital asset partner for Argentina’s national football team in Latin America. Ondo sought a path with the SEC for Ethereum-based tokenised securities efforts, while Anchorpoint prepared a HKDAP stablecoin push. Kraken, meanwhile, said it rejected a ransom demand tied to an extortion attempt affecting about 2,000 accounts.
By the numbers
- Bitcoin: resistance $72,500 to $72,600; next $74,100; key support $69,800
- Deeper supports: $68,450 (200-day MA), $68,200 (0.618 Fib)
- Market cap: about $2.49tn, down roughly 0.8% in 24 hours
- Sentiment: Fear and Greed Index 12; BTC RSI about 38
- Flows: spot BTC ETFs about $786m inflows last week; MicroStrategy bought 13,927 BTC for $1bn
Key takeaways
- If BTC clears $74,100 on strong volume, bulls can press for $75,000 and then $80,000.
- If BTC loses $69,800, expect fast tests of $68,450 and $68,200.
- ETH’s channel break matters most on the retest, not the initial burst.
- Oil above $100 raises the odds of macro-driven whipsaws in crypto.
- Regulation remains a grind higher, yet enforcement keeps punishing weak controls.
For more on this topic see our deep-dives on Bitcoin Price Analysis: Forecast Frameworks, Trends and BTC vs ETH, Bitcoin Bollinger Band Squeeze: Reading Volatility Compression in BTC, and Bitcoin, Presales and Crypto Regulation: A Market Briefing.
What our analysts watch: Three readings turn the BTC/ETH ratio from a chart curiosity into a working signal. ETH/BTC futures basis on regulated venues (CME, EUREX) shows whether institutional rotation is leading or lagging spot.
ETH staking inflows and validator queue depth measure structural demand for the underlying. ETF flow divergence (positive net flows on BTC products while ETH products see outflows) is the cleanest confirmation of risk-off rotation.
When the spread rises with all three confirming, BTC outperformance tends to extend; when the spread rises but flow divergence narrows, the move is mean-reverting and traders fade rather than chase.
Frequently asked questions
Why does Bitcoin outperform Ethereum during risk-off?
Bitcoin has the deepest spot liquidity, the longest trading history as a macro hedge, and the largest regulated derivatives market. When global liquidity tightens, capital concentrates into the most liquid asset in any given asset class.ETH and altcoins, with thinner books and a more cyclical demand profile (DeFi, NFT, smart-contract activity), de-rate first. The U.S.Federal Reserve publishes the dollar-liquidity context that drives these regime shifts.
How is the BTC/ETH ratio actually calculated?
The ratio is BTC price divided by ETH price (e.g. BTC at $70,000 and ETH at $3,500 gives a ratio of 20.0). A rising ratio means BTC is outperforming, a falling ratio means ETH is outperforming. Investopedia explains the construction in depth. Most desks chart the inverse ratio (ETH/BTC) on a log scale to read percentage moves cleanly.
When is the BTC/ETH spread a tradable signal?
The spread is tradable when at least two of three confirming inputs align: ETF flow divergence, futures basis spread on CME or EUREX, and staking inflow direction. A spread move with confirmation tends to extend; a spread move without confirmation reverses faster than retail expects. CoinDesk publishes the daily flow data most desks pair with the chart.
How should retail traders use the spread to size positions?
Treat the BTC/ETH ratio as an allocation tool, not a binary trigger. When the spread is rising and confirmed, overweight BTC and underweight ETH within a fixed crypto allocation rather than rotating all-or-nothing. Volity research builds the underlying flow models on its CySEC 186/12 venue and uses the spread to balance exposure across cycles.
Related guides
- Bitcoin explained
- Ethereum explained
- Cryptocurrency trading
- Crypto trading platforms
- Best crypto investments
Volity operates a trading platform and also publishes educational and analytical content about trading. The content on this page is for educational purposes only and should not be considered financial advice. Volity may benefit commercially when readers open trading accounts through links on this site.
Our content is produced and reviewed under documented editorial standards; comparison and review methodology is published here.