The Gravestone Doji is a powerful candlestick pattern signaling potential bearish reversals in financial markets. Its distinct long upper shadow indicates strong selling pressure, suggesting a shift from an uptrend to a downtrend. This guide covers how to identify, confirm, and trade the Gravestone Doji, along with essential risk management techniques.
While understanding Gravestone Doji Candlestick is important, applying that knowledge is where the real growth happens. Create Your Free Forex Trading Account to practice with a free demo account and put your strategy to the test.
What is a Gravestone Doji Candlestick Pattern?
The Gravestone Doji candlestick pattern serves as a potent indicator of a potential market downturn. Its distinct appearance and formation process provide traders with an early warning sign of weakening buying pressure and increasing selling pressure. This pattern is a specific type of candlestick pattern that signals a bearish reversal, making it a key component of technical analysis for many traders.
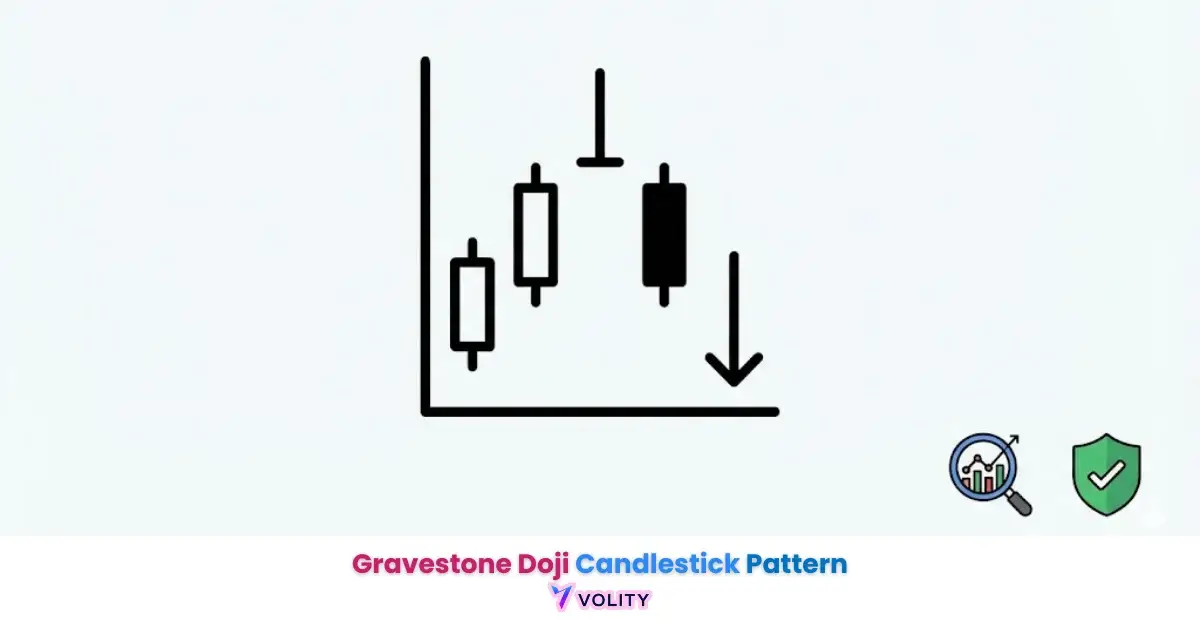
A Gravestone Doji is characterized by its open, low, and close prices being near or at the same level, and a long upper shadow. Visually, it resembles a gravestone, with a long wick extending upwards and a virtually flat body at the very bottom of the trading range. This unique structure immediately catches the eye of technical analysts, suggesting a significant shift in market dynamics. The pattern’s formation indicates a strong rejection of higher prices by sellers.
How It Takes Shape?
The Gravestone Doji forms when the open price, close price, and low price of a trading session are nearly identical, or at least very close to each other. This creates a minimal, if any, real body located at the bottom of the candlestick.
Crucially, a long upper shadow extends significantly upwards from this real body, representing the session’s high price. This long upper shadow signifies that during the trading period, buyers managed to push the price considerably higher, but ultimately failed to sustain that momentum.
By the close of the session, sellers had overwhelmed buyers, driving the price back down to the opening level or even lower, near the session’s low.
The pattern is most significant when it appears at the top of an established uptrend, indicating a potential exhaustion of buying power and the imminent start of a bearish reversal pattern.
What a Gravestone Doji Indicates?
The primary indication of a Gravestone Doji is a bearish reversal signal. It suggests that while buyers initially attempted to drive prices higher during the trading session, they were ultimately unsuccessful. The long upper shadow represents this failed bullish attempt, where selling pressure stepped in decisively to push prices back down to the opening level.
This shift in price action signifies a loss of control by buyers and a strong reassertion of power by sellers. Consequently, the Gravestone Doji often marks a potential turning point in the market trend, implying that the preceding uptrend is likely to reverse into a downtrend.
Traders interpret this as a strong warning to consider exiting long positions or initiating short positions.
Is a Gravestone Doji bullish or bearish?
A Gravestone Doji is fundamentally a bearish candlestick pattern. Its formation explicitly signals a potential bearish reversal in the market. The pattern’s structure, with its long upper shadow and open, low, and close prices concentrated at the bottom, demonstrates a clear rejection of higher prices.
This indicates that despite initial buying efforts, sellers dominated by the end of the trading period, pushing the price back down. Therefore, traders interpret the Gravestone Doji as a strong warning sign that the existing uptrend may be coming to an end, setting the stage for a downward price movement.
What is the difference between Gravestone Doji and Dragonfly Doji?
The Gravestone Doji and Dragonfly Doji are often considered mirror images of each other, each signaling a potential trend reversal but in opposite directions. These distinctions are critical for accurate market interpretation.
While both are types of candlestick patterns with a minimal real body, their placement and the direction of their long shadows determine their market signal.
Key Distinctions
The Gravestone Doji signals a bearish reversal and is characterized by a long upper shadow, with the open, low, and close prices near the bottom. It typically appears at the top of an uptrend, indicating that buyers lost control after attempting to push prices higher.
In contrast, the Dragonfly Doji is its bullish counterpart, signaling a potential bullish reversal. It features a long lower shadow, with the open, high, and close prices near the top of the candle.
This pattern typically forms at the bottom of a downtrend, suggesting that sellers pushed prices lower, but buyers aggressively stepped in to bring the price back up by the close.
Both patterns have a small or non-existent real body, but the direction of the prominent shadow (upper for Gravestone, lower for Dragonfly) is the key differentiator, indicating the dominant force at play.
| Feature | Gravestone Doji | Dragonfly Doji |
| Signal | Bearish Reversal | Bullish Reversal |
| Appearance | Long Upper Shadow | Long Lower Shadow |
| Body | Open/Low/Close at Bottom | Open/High/Close at Top |
| Trend | At top of Uptrend | At bottom of Downtrend |
| Psychology | Buyers fail to hold gains | Sellers fail to hold losses |
Ready to Elevate Your Trading?
You have the information. Now, get the platform. Join thousands of successful traders who use Volity for its powerful tools, fast execution, and dedicated support.
Create Your Account in Under 3 MinutesHow reliable is the Gravestone Doji pattern?
The Gravestone Doji pattern is considered a valid reversal signal, but its reliability varies significantly based on market context and the presence of confirmation. Traders should never rely solely on this pattern without additional validating signals.
Understanding how to confirm the pattern and integrate it with other technical analysis indicators is crucial for improving its accuracy and your trading outcomes.
Validating the Signal
Confirmation is crucial for the Gravestone Doji, often requiring a subsequent bearish candle or a break below a key support level. Trading a Gravestone Doji alone, without additional confirmation, is generally considered risky due to the pattern’s varying success rates.
To validate the signal, traders often look for a strong bearish candle in the next trading session that closes below the Gravestone Doji’s low. Another robust confirmation comes from the pattern appearing at a resistance level after a significant uptrend, which significantly enhances its reliability.
Increased volume during the Gravestone Doji’s formation or the subsequent bearish candle can further strengthen the reversal signal, indicating strong selling pressure. Without these confirming factors, the Gravestone Doji might represent a temporary pause or a false signal rather than a genuine bearish reversal.
How to Use Gravestone Doji with Other Indicators
To improve the reliability of a Gravestone Doji signal, traders often combine it with other technical analysis indicators. For instance, observing Moving Averages can provide context; if the Gravestone Doji forms after the price has been trading above a key moving average (e.g., 50-period or 200-period) and the subsequent bearish candle breaks below it, the signal gains strength. The Relative Strength Index (RSI) is another powerful tool; if the Gravestone Doji appears when the RSI is in overbought territory (typically above 70), it adds a strong confluence to the bearish reversal signal.
An overbought RSI indicates that the asset’s price has risen too steeply and is due for a correction, aligning perfectly with the Gravestone Doji’s implied market psychology. Integrating these indicators helps filter out false signals and provides a more robust trading setup.
How to Trade the Gravestone Doji Pattern
Developing an effective trading strategy for the Gravestone Doji involves precise planning for entry points, stop-loss placement, and take-profit targets. The optimal entry point for a short trade typically occurs after the confirmation candle closes below the Gravestone Doji’s low, ensuring that the bearish momentum is sustained. For stop-loss placement, it is crucial to place it above the high price of the Gravestone Doji’s upper shadow. This acts as an invalidation point; if the price moves above this level, the bearish reversal signal is likely negated. A comprehensive exit strategy should also consider partial profit-taking at intermediate support levels to lock in gains and reduce overall exposure.
What are the limitations of the Gravestone Doji?
Despite its potential as a bearish reversal signal, the Gravestone Doji has inherent limitations and can lead to common pitfalls if not understood correctly. Traders often encounter situations where the pattern appears, but the market fails to reverse, leading to frustration and potential losses. Recognizing these limitations is as important as understanding the pattern itself.
Addressing False Signals
Many traders observe Gravestone Dojis, but the market does not always reverse, leading to questions about what went wrong. The primary reason for these false signals is a lack of proper confirmation or the pattern appearing outside of a clear uptrend.
Historical backtesting suggests that while the Gravestone Doji is a valid reversal signal, its success rate varies significantly based on market context and confirmation. If the pattern forms within a choppy or sideways market, or in a downtrend, its reliability as a reversal signal is significantly diminished.
Similarly, if the subsequent candle does not provide strong bearish confirmation (e.g., a strong bearish close below the Doji’s low), the initial signal should be treated with skepticism.
Without these critical contextual and confirming elements, a Gravestone Doji can simply represent a temporary pause in an ongoing trend or market indecision, rather than a definitive shift.
Subtle but Important Differences
Traders often confuse the Gravestone Doji with the Shooting Star candlestick pattern due to their visual similarities: both feature a small real body at the bottom of the candle and a long upper shadow, appearing at the top of an uptrend. However, a crucial difference lies in their real body formation.
For a Gravestone Doji, the open price, low price, and close price are virtually identical, resulting in little to no real body.
In contrast, a Shooting Star has a small real body, where the close price is below the open price (a bearish candle) or slightly above it (a bullish candle), but it is distinctly present. This subtle difference indicates a slightly different degree of selling pressure by the close of the session.
While both are bearish reversal patterns, the Gravestone Doji typically signifies a more extreme rejection of higher prices, as sellers manage to push the price all the way back to the opening level.
What is the perfect Gravestone Doji?
The concept of a “Perfect Gravestone Doji” refers to a specific, high-conviction variant of the pattern that offers an even stronger bearish reversal signal. This ideal formation provides clearer indications of market sentiment and potential price direction.
Beyond identifying this specific variant, effective risk management and understanding the psychology of trading are paramount for long-term success when using the Gravestone Doji.
Identifying the ‘Perfect’ Gravestone Doji
A “Perfect Gravestone Doji” is identified when the open price, low price, and close price are exactly at the same level, forming a truly flat body. This precise alignment indicates an even more absolute rejection of higher prices by sellers.
In a perfect scenario, the session begins, price drops to the low, rallies significantly, but then collapses completely back to the opening/low price by the close. The absence of any real body whatsoever, with a long upper shadow, underscores an overwhelming selling pressure that completely negates all bullish attempts.
While rare, identifying a Perfect Gravestone Doji can provide a higher-confidence signal for a potential bearish reversal, though it still requires confirmation.
The Indispensable Role of Risk Management
Even with a strong signal like the Gravestone Doji, effective Risk Management is indispensable for capital preservation. No trading signal is 100% accurate, and false signals are an inherent part of the market. Therefore, implementing strict risk management protocols is paramount.
This includes defining a clear stop-loss placement for every trade, typically just above the high of the Gravestone Doji’s upper shadow, to limit potential losses if the trade goes against your prediction. Establishing realistic take-profit targets based on market structure or a favorable risk-reward ratio is also crucial.
Furthermore, proper position sizing ensures that no single trade can significantly deplete your trading capital. By consistently adhering to these principles, traders can protect their accounts from adverse market movements, even when a seemingly strong bearish reversal pattern fails to materialize.
Managing Emotion
The Psychology of Trading plays a critical role in how traders react to patterns like the Gravestone Doji. Even with clear signals, emotions such as fear of missing out (FOMO) or revenge trading after a false signal can lead to poor decision-making.
For instance, seeing a Gravestone Doji and jumping into a short trade without confirmation due to FOMO can result in unnecessary losses. Conversely, experiencing a false signal might lead to revenge trading, where a trader takes another, often riskier, trade to recover losses, further compounding mistakes.
Understanding market sentiment and managing personal emotional responses are key to sticking to a predefined trading plan. Discipline in waiting for confirmation, adhering to stop-loss and take-profit levels, and accepting that not every trade will be a winner are crucial for long-term success.
Turn Knowledge into Profit
You've done the reading, now it's time to act. The best way to learn is by doing. Open a free, no-risk demo account and practice your strategy with virtual funds today.
Open a Free Demo AccountReal-World Application & Backtesting Insights
The practical application of the Gravestone Doji in real-world trading requires a data-driven approach, moving beyond anecdotal evidence. Historical backtesting is essential for understanding the pattern’s true efficacy in chosen markets and timeframes. While the Gravestone Doji is a valid reversal signal, its success rate varies significantly based on market context and confirmation. This means a Gravestone Doji might perform differently in the Forex market compared to the stock market, or on a 15-minute chart versus a daily chart.
Traders can conduct their own historical backtesting by examining past charts for occurrences of the Gravestone Doji. For each instance, they should record the preceding trend, the presence of confirmation (e.g., a bearish follow-through candle), and the subsequent price action.
Analyzing these results across various assets and timeframes helps build a personal understanding of the pattern’s reliability under specific conditions. Perceived “failures” of the Gravestone Doji, as highlighted by common forum pain points, are often due to a lack of rigorous backtesting and a failure to account for market specifics.
For example, a Gravestone Doji might be highly effective on daily charts for a technology stock but show poor performance on a 5-minute chart for a highly volatile cryptocurrency. This empirical approach allows traders to quantify the pattern’s edge and integrate it effectively into their personalized trading strategy.
Key Takeaways
- The Gravestone Doji is a bearish reversal candlestick pattern with a long upper shadow and a small real body at the low.
- Confirmation from subsequent bearish candles, volume, or resistance levels is crucial for its reliability.
- It is often confused with the Shooting Star, but the Gravestone Doji has virtually no real body.
- The “Perfect Gravestone Doji” has the open, low, and close prices exactly aligned, signaling heightened conviction.
- Incorporating Risk Management and understanding the Psychology of Trading are vital for successful application.
- Historical Backtesting is essential to understand its performance across different assets and timeframes.