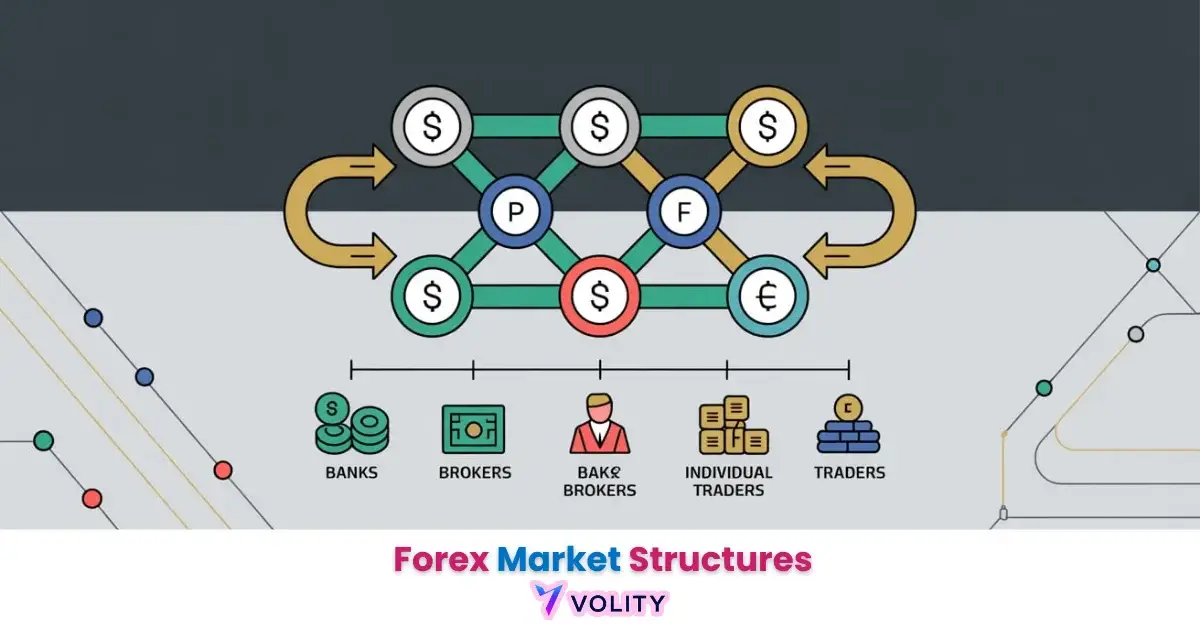
Forex market structure provides the roadmap for understanding price action, trends, and reversals. Mastering its core components, from identifying key levels to recognizing fractal patterns, empowers traders to make informed decisions. This guide will teach you to decipher market phases, develop robust strategies, and avoid common pitfalls for more consistent trading.
While understanding Market Structures is important, applying that knowledge is where the real growth happens. Create Your Free Forex Trading Account to practice with a free demo account and put your strategy to the test.
Why is understanding market structure important for forex traders?
Understanding market structure is crucial for forex traders because it provides a roadmap of price action, revealing the underlying forces of supply and demand. It helps in identifying trends, potential reversals, and optimal entry or exit points. Without this fundamental comprehension, trading decisions often lack direction and are prone to emotional biases.
Understanding market structure is foundational for 80% of successful forex trading strategies.
What is Market Structure in Forex Trading?
Market structure in forex trading refers to the way price organizes itself on a chart, characterized by a series of highs and lows. It acts as the “DNA” of price movement, reflecting the collective behavior of market participants. This structure helps traders identify trends, consolidation phases, and potential shifts in momentum.
The forex market, processing over $7 trillion daily, is the most liquid financial market globally, and its sheer volume constantly shapes these discernible structures.
Trends, Support & Resistance
The foundation of forex market structure rests on two primary pillars: trends and support and resistance levels. These elements dictate how price moves, consolidates, and potentially reverses. By accurately identifying these pillars, traders gain a clearer perspective on the prevailing market sentiment and potential future price paths.
Understanding Bullish, Bearish, and Ranging Markets
The basic types of market structure in forex are categorized into bullish, bearish, and ranging markets. A bullish trend is characterized by price making consecutive higher highs (HH) and higher lows (HL), indicating strong buying pressure. Conversely, a bearish trend forms when price makes lower highs (LH) and lower lows (LL), signaling dominant selling pressure.
Identifying higher highs and higher lows is a primary indicator of a bullish trend, while lower highs and lower lows signal a bearish trend. A ranging market, also known as a sideways or consolidation phase, occurs when price moves horizontally between defined support and resistance levels without a clear directional bias.
| Market Type | Key Characteristics | Price Action | Trading Bias | Example Strategy |
| Bullish | HH & HL | Upward movement | Buy | Buy on pullbacks |
| Bearish | LH & LL | Downward movement | Sell | Sell on rallies |
| Ranging | Defined S&R | Sideways movement | Neutral | Buy S, Sell R |
Identifying Key Support and Resistance Levels
Support and resistance (S&R) levels are critical areas on a chart where price has historically struggled to break through, often leading to reversals or consolidations. Support levels are price points where buying interest is strong enough to prevent further declines, while resistance levels are where selling interest is robust enough to halt further advances.
Traders identify S&R using historical price data, focusing on previous swing highs and swing lows. The more times price interacts with and respects a level, the stronger its significance. Understanding how price action reacts at these levels provides valuable clues about potential market direction.
Ready to Elevate Your Trading?
You have the information. Now, get the platform. Join thousands of successful traders who use Volity for its powerful tools, fast execution, and dedicated support.
Create Your Account in Under 3 MinutesBreakouts & Order Blocks
Understanding how market structure shifts is vital for adapting trading strategies to changing market conditions. These shifts often signal a change in the prevailing trend or a move from consolidation to directional movement. Identifying these changes early allows traders to align their positions with the new market bias, improving the probability of successful trades.
Recognizing Valid Breakouts vs. False Breakouts
Identifying market structure shifts often involves recognizing valid breakouts from key support and resistance levels or trendlines. A breakout occurs when price moves decisively beyond a previously established S&R level, indicating a potential continuation or reversal of the trend.
However, false breakouts, also known as “fakeouts,” are common where price briefly penetrates a level only to reverse quickly, trapping traders. Retail traders frequently misinterpret market structure in lower timeframes due to noise, leading to premature entries or exits, a common pain point.
To catch shifts early, look for strong momentum, a retest of the broken level, and confirmation on higher timeframes to validate the move.
The Role of Order Blocks and Imbalances
Order blocks are specific candlestick formations that represent areas where institutional traders have placed large orders, often leading to significant price movements. These blocks indicate zones of concentrated supply or demand. When price returns to an order block, it often reacts strongly as remaining institutional orders are filled.
Understanding order blocks helps traders identify potential turning points in the market. Liquidity plays a crucial role around these areas, as institutions often target zones where stop-losses are clustered to fill their large orders, creating rapid price shifts.
How to Trade Forex Market Structure
Market structure provides the essential framework for developing and refining robust trading strategies. By understanding the current market phase—whether bullish, bearish, or ranging—traders can select appropriate tactics for entry, exit, and risk management.
Developing Entry and Exit Strategies
- Using market structure to improve your trading strategy involves pinpointing optimal entry and exit points.
- In a bullish trend, traders typically look for entry points at higher lows, anticipating a continuation to a new higher high.
- Conversely, in a bearish trend, entries are often sought at lower highs, expecting price to drop to a new lower low.
- Profit targets can be set at the next significant resistance level in a bullish market or support level in a bearish market.
- Stop losses are logically placed beyond the invalidation point of the market structure, such as below a swing low in an uptrend or above a swing high in a downtrend.
Integrating Risk Management with Market Structure
Effective risk management is paramount in trading, and market structure provides a logical basis for its application. By identifying clear structural points like swing highs and lows, traders can determine precise stop-loss placements. This allows for accurate calculation of the risk per trade.
Proper position sizing is then determined based on the distance to the stop loss and the trader’s acceptable risk percentage per trade. Effective risk management, including proper position sizing and stop-loss placement, is a key differentiator for professional traders.
This approach ensures that even if a trade goes against you, the potential loss is controlled and predetermined.
Tools for Market Structure Analysis
Several tools are best for identifying market structure, primarily found within charting platforms like TradingView or MetaTrader. Traders also use Fibonacci retracement tools to identify potential pullback levels within a trend.
Common Pitfalls in Market Structure Analysis (and How to Avoid Them)
Even experienced traders can fall victim to common pitfalls when analyzing market structure, leading to suboptimal trading outcomes. These mistakes often stem from a lack of comprehensive understanding or emotional biases.
Recognizing and actively avoiding these traps is as crucial as understanding the structure itself, ensuring that your analysis translates into effective and profitable trading decisions.
Ignoring Multi-Timeframe Analysis
A common mistake traders make when analyzing market structure is focusing solely on a single timeframe. This can lead to misinterpretations, as a market appearing bullish on a 5-minute chart might be in a strong bearish trend on the daily chart.
Retail traders frequently misinterpret market structure in lower timeframes due to noise, leading to premature entries or exits. To avoid this, always perform multi-timeframe analysis, checking the overall trend and key S&R levels on higher timeframes (e.g., daily, 4-hour) before refining your entry and exit points on lower timeframes (e.g., 1-hour, 15-minute). Confluence across timeframes significantly increases the probability of a successful trade.
Over-Complicating Your Charts
Another pitfall is over-complicating charts with too many indicators. While technical analysis tools can offer supplementary information, an excessive number of indicators can obscure the clear market structure and price action. Cluttered charts make it difficult to identify essential swing highs, swing lows, and support/resistance levels.
Traders should aim for clean charts, prioritizing raw price action and only using a few, well-understood indicators that complement their market structure analysis, rather than overwhelming it.
Emotional Trading and Impatience
Emotional trading and impatience are significant psychological pitfalls that can distort market structure analysis. Fear of missing out (FOMO) can lead to premature entries, while fear of losing can cause early exits, even when market structure still supports the trade. Impatience often results in forcing trades in ranging markets or entering against a clear trend.
These emotions can lead to misinterpreting structural cues or acting impulsively, undermining even the most sound technical analysis. Managing emotions is crucial for disciplined execution of market structure-based strategies.
The Fractal Nature of Forex Market Structure
The fractal nature of market structure implies that similar patterns repeat across different timeframes, though with varying degrees of clarity. This concept is a unique angle often overlooked by competitors.
It means that the same principles of trends, support, and resistance that apply to a daily chart also apply to a 1-hour or even a 5-minute chart. Understanding this self-similarity across scales provides a deeper, more robust framework for analyzing market behavior and confirming trade ideas.
Understanding Self-Similarity Across Timeframes
The concept of fractals in forex market structure suggests that charts exhibit self-similarity, where smaller patterns resemble larger ones. For instance, a strong bullish trend on a weekly chart might consist of multiple smaller bullish trends, bearish pullbacks, and ranging phases on a daily or hourly chart.
This directly answers the forum question, “Is market structure applicable to all timeframes?” Yes, it is, because of this fractal property. The Fractal Market Hypothesis posits that markets are inherently fractal, meaning they are not perfectly efficient but rather exhibit patterns that repeat at different scales.
This understanding helps traders to contextualize price movements, seeing micro-trends as components of macro-trends.
Practical Implications for Multi-Timeframe Trading
Recognizing the fractal nature of market structure significantly enhances multi-timeframe trading. Traders can identify the dominant trend and key structural levels on a higher timeframe, such as the daily chart, to establish a broader bias.
Then, they can zoom into lower timeframes, like the 1-hour or 15-minute chart, to pinpoint precise entry and exit points within that larger trend. This approach leverages the clarity of higher timeframes for direction and the precision of lower timeframes for execution.
Understanding market microstructure provides insight into the smallest-scale interactions, where individual orders and quotes shape these micro-patterns, further illustrating the fractal concept.
Turn Knowledge into Profit
You've done the reading, now it's time to act. The best way to learn is by doing. Open a free, no-risk demo account and practice your strategy with virtual funds today.
Open a Free Demo AccountComparing Market Structures: Bullish, Bearish, Ranging
| Characteristic | Bullish Market Structure | Bearish Market Structure | Ranging Market Structure |
| Price Action | Higher Highs, Higher Lows | Lower Highs, Lower Lows | Sideways, no clear trend |
| Trend Direction | Upward | Downward | Horizontal |
| Volume | Often increases on rallies | Often increases on declines | Decreases, inconsistent |
| Sentiment | Optimistic, buying | Pessimistic, selling | Indecisive, consolidating |
| Key Levels | Support holds well | Resistance holds well | Price bounces between S&R |
| Strategy Bias | Buy dips, trend-follow | Sell rallies, trend-follow | Buy S, Sell R, scalp |
The Bottom Line
Mastering market structures in forex trading is an indispensable skill for any serious trader. It provides the essential framework for deciphering price action, identifying trends, and anticipating potential shifts. By understanding the core components like higher highs, lower lows, support, and resistance, traders can develop robust strategies for entry, exit, and crucial risk management.
Avoiding common pitfalls such as ignoring multi-timeframe analysis or over-complicating charts ensures a clearer perspective. Furthermore, recognizing the fractal nature of markets enhances precision across all timeframes. Ultimately, a deep comprehension of market structure empowers traders to make informed, disciplined decisions, transforming raw price data into actionable insights for consistent performance.
Key Takeaways
- Market structure is foundational for identifying trends, reversals, and optimal entry/exit points in forex trading.
- Key components include trends (bullish, bearish, ranging) and critical support and resistance levels.
- Understanding breakouts, order blocks, and multi-timeframe analysis helps confirm market shifts and avoid false signals.
- Effective trading strategies integrate market structure for precise entry, exit, and robust risk management.
- The fractal nature of markets means patterns repeat across timeframes, enhancing multi-timeframe trading precision.