Morning Star pattern recognition involves false signal generation when patterns form at major support levels during institutional liquidity grabs. The third candle volume may spike falsely due to algorithmic trading rather than genuine buyer conviction. News-driven gaps at the opening of the second candle can distort pattern anatomy in ways that invalidate the reversal signal. Trading Morning Stars in isolation without structural support context produces high failure rates. Past performance is not indicative of future results. Capital at risk.
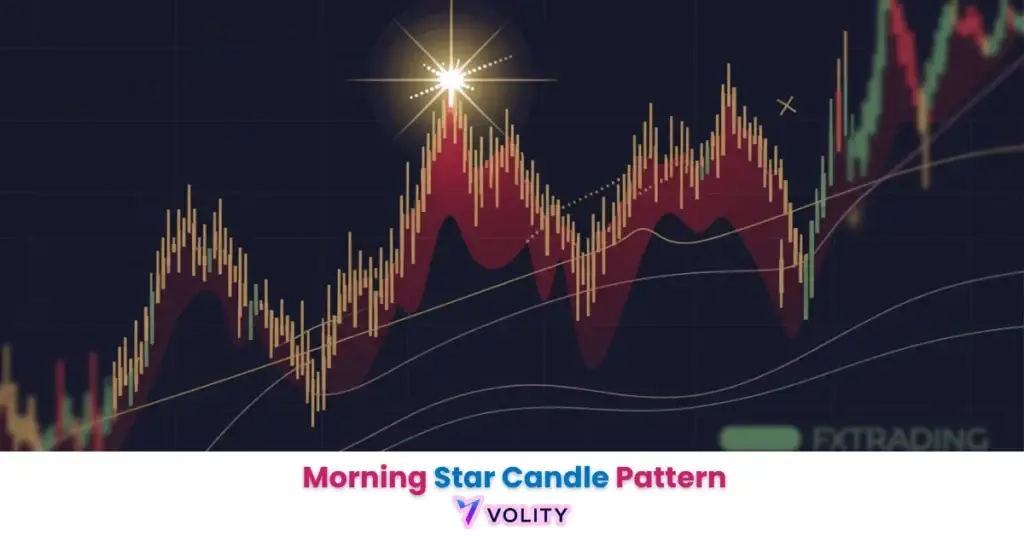
The Morning Star is a three-bar candlestick formation that signals a bullish reversal at the end of a downtrend. It consists of a large bearish candle, a small-bodied indecision candle, and a large bullish candle that closes deep into the first candle’s body. In 2026, this pattern remains a cornerstone of price action analysis, providing a visual representation of the handoff from sellers to buyers at key support levels.
The Morning Star pattern functions as one of the most reliable visual cues in Japanese candlestick patterns analysis. This formation identifies the specific point where selling pressure exhausts and buyers begin to overwhelm the remaining supply. The candlestick pattern family it belongs to is documented alongside the doji that most often forms its middle bar. It serves as a foundational tool for traders seeking to enter long positions at the start of a new uptrend.
The 2026 trading landscape utilizes advanced algorithmic filters to separate genuine Morning Star reversals from temporary liquidity sweeps. Mastering the anatomy of these three candles allows investors to navigate volatile markets with objective entry and exit parameters.
While understanding Morning Star Candle Pattern is important, applying that knowledge is where the real growth happens. Create Your Free Forex Trading Account to practice with a free demo account and put your strategy to the test.
What is the Morning Star candlestick pattern?
The Morning Star is a three-candle bullish reversal pattern that signifies the end of a downtrend and the beginning of a potential upward move.
Morning Star patterns appear in three distinct stages that represent the transition from bearish dominance to bullish control. The metaphor is apt, the “star” (middle candle) appearing in darkness signals the coming dawn. Steve Nison introduced the terminology to Western technical analysis in Japanese Candlestick Charting Techniques, drawing on a Japanese charting tradition that long predates it. The pattern has remained a cornerstone of candlestick analysis because it captures genuine market psychology.
The handoff from sellers to buyers defines Morning Star significance. During the first candle, sellers controlled price, the large bearish body proved institutional selling. During the second candle, market indecision appeared. During the third candle, buyers seized control. This three-stage shift shows structural power transfer.
- The visual metaphor: The “star” (middle candle) appearing before the “sunlight” (third candle)
- Significance of the “Handoff”: Transfer of power from sellers to buyers
- Historical context: Steve Nison’s Japanese Candlestick Charting Techniques brought the pattern to Western analysis
The pattern is treated as a high-confidence reversal signal because its three-stage sequence is unambiguous to identify after the fact, which is also its main limitation: confirmation only arrives once the third candle has closed.
The Bullish Reversal Philosophy
A bullish reversal is a structural shift where market demand decisively overcomes prevailing supply at a discounted price level.
Bullish reversals begin with exhaustion. Sellers drive price lower until no more supply exists at any lower level. This exhaustion causes selling pressure to vanish. When the second candle’s small body forms, it signals that neither buyers nor sellers control price. This indecision represents the “turning point” where conviction is about to shift.
Emergence of institutional buy-side liquidity completes the reversal. The third candle’s large bullish body and high close prove that buyers accumulated positions at the depressed price level. Once this conviction emerges, the uptrend often accelerates as trapped sellers are forced to cover shorts.
Ready to Elevate Your Trading?
You have the information. Now, get the platform. Join thousands of successful traders who use Volity for its powerful tools, fast execution, and dedicated support.
Create Your Account in Under 3 MinutesAnatomy of the Morning Star: The Three Essential Candles
The Morning Star formation requires a large bearish candle, a small-bodied indecision candle, and a strong bullish confirmation candle. Mastering how to read candlesticks is essential for correctly identifying these components.
The first candle must be long and bearish. This large red body confirms the downtrend context and establishes the level from which reversal will measure. A candle with a small body fails to establish true downtrend conviction. The first candle needs a body long enough to establish that sellers were genuinely in control, not a marginal down-close inside an existing range.
The second candle represents the “star”, the crucial indecision zone. A small body (whether doji or spinning top) indicates that neither buyers nor sellers controlled the session. Often this candle gaps down, signaling continuation of selling on the open. However, the closing near the opening shows no follow-through. This creates a visual gap that emphasizes the transition point.
The third candle delivers the confirmation. A large bullish body that closes above the 50% midpoint of the first candle’s body is the standard confirmation; most traders look for the third candle to reach at least halfway up the first candle’s body. If this candle closes below 50% of the first candle, the pattern is classified as weak and unreliable for reversal trades. Unlike a single candlestick pattern which may be noise, the three-candle sequence provides institutional confirmation.
- Candle 1: A tall bearish body confirming the existing downtrend
- Candle 2: The “Star” – A small body (Doji or Spinning Top) that often gaps down
- Candle 3: The “Confirmation” – A bullish body closing above the 50% mark of Candle 1
The midpoint rule is the standard filter, and it is long-established rather than new: a pattern where Candle 3 fails to close above 50% of Candle 1 is treated as a weak signal. The Morning Star reference states the same halfway requirement.
Single Candlestick Pattern provides detailed analysis of individual candle formations that compose the pattern.
How to trade the Morning Star pattern effectively?
High-probability Morning Star trades utilizes volume confirmation and structural support to validate the reversal entry.
Entry timing requires discipline. Impatient traders enter during the second candle’s formation, hoping the reversal will accelerate. This approach fails because the reversal is not yet confirmed. Professional traders wait for the close of the third candle, the moment confirmation arrives. Entering exactly at this close or on a retest of the “star” low during the next session provides high-probability entries.
Stop-loss placement protects against pattern failure. The lowest wick of the second candle represents the “floor” where institutional buyers would defend. Placing a stop slightly below this level, perhaps 5-10 pips below on a daily chart, ensures protection without excessive width that harms the risk-reward ratio.
RSI confirmation adds a second layer. During pattern formation, the RSI should rise from oversold (<30) back above 30. This indicator confirms that momentum has genuinely shifted, not just price. When the third candle closes and RSI simultaneously crosses back above 30, the convergence shows powerful confirmation.
- Entry: At the close of Candle 3 or on a retest of the “Star” low
- Stop-Loss placement: Below the lowest wick of the second candle
- Confirmation: RSI moving from <30 (oversold) to >30 during the pattern formation
Worked example: a Morning Star forms on USD/JPY at a multi-week support level, with the third candle closing above the midpoint of the first on expanding volume. Entry is taken at the close of the third candle, the stop sits below the low of the second, and the first target is the next resistance level above. The structure supplies the target; the pattern only supplies the timing. This is an illustration of the method, not a record of a specific trade. Past performance is not indicative of future results.
Technical Indicators for Trading explains confirmation filters that enhance pattern reliability.
Morning Star vs. Evening Star: Identifying Trend Inflections
The Morning Star and Evening Star identifies the critical inflection points between bullish and bearish market regimes.
Mirror-image patterns reveal the contrast between reversals. The Evening Star appears at the top of an uptrend and signals bearish reversal. The first candle is large and bullish. The second candle is small-bodied indecision. The third candle is large and bearish closing into the first candle’s body. Where the Morning Star signals buyers taking control, the Evening Star signals sellers regaining dominance.
Context determines which pattern is valid. A Morning Star at the bottom of a downtrend is high-conviction. A Morning Star at the top of an uptrend is a failed false signal, there is no downtrend to reverse. Similarly, an Evening Star at the top of an uptrend is high-conviction. An Evening Star at the bottom of a downtrend is a failed signal.
| Characteristic | Morning Star Pattern | Evening Star Pattern |
| Market Context | Bottom of Downtrend | Top of Uptrend |
| Signal Type | Bullish Reversal | Bearish Reversal |
| First Candle | Long Bearish | Long Bullish |
| Middle Candle | Small Body (Doji/Spinning Top) | Small Body (Doji/Spinning Top) |
| Third Candle | Long Bullish (closes high) | Long Bearish (closes low) |
| Tested reversal rate | Bullish reversal 78% of the time | Bearish reversal 72% of the time |
Reversal rates are Thomas Bulkowski’s tested figures across 103 candlestick patterns, published on the Morning Star page of his pattern site. Understanding both patterns lets traders recognise reversals in both directions.
Avoiding False Signals and Improving Reliability
Structural location and volume expansion identifies the difference between a high-conviction Morning Star and a false breakout. Applying support and resistance trading levels ensures that the pattern forms at a significant market junction.
The context rule is essential. A Morning Star in a ranging market is often just noise that corrects itself without producing a sustained reversal. A Morning Star at a multi-week support level or at the 200-period moving average is high-conviction because structural buyers defend these levels.
Volume analysis separates real reversals from fakes. Falling volume on the third candle is a red flag. It suggests that the bullish close is driven by short-covering rather than new buying. High-conviction reversals show volume expansion on the third candle; heavy volume on the third trading day is the documented confirmation, and the specific multiple you demand is a matter of preference rather than a fixed rule.
Multi-timeframe analysis prevents whipsaws. A 15-minute Morning Star is far more reliable when the 4-hour chart shows bullish structural bias (HH/HL pattern). Confirming the pattern across multiple timeframes ensures alignment with institutional bias.
- The “Context Rule”: A Morning Star in a ranging market is often just noise
- Volume Analysis: Why falling volume on Candle 3 is a major red flag
- Multi-Timeframe Analysis: Confirming the 15-minute Morning Star with a 4-hour bullish bias
Support and Resistance Trading explains how to identify structural levels that validate Morning Star entries.
Turn Knowledge into Profit
You have done the reading, now it is time to act. The best way to learn is by doing. Open a free, no-risk demo account and practice your strategy with virtual funds today.
Open a Free Demo AccountThe Role of Psychology in Pattern Recognition
Emotional discipline ensures that traders wait for the full three-candle formation before executing a reversal strategy. Applying rigorous risk-management protocols helps maintain the mental clarity needed for pattern verification.
FOMO (Fear of Missing Out) kills many would-be successful trades. A trader sees the second candle close and thinks “the reversal is starting, I should enter now!” This premature entry often fails because the confirmation candle has not yet arrived. The pattern may complete successfully tomorrow, but the early trader is already stopped out with a loss.
Adhering to the trading plan requires recognizing that the “Close of Candle 3” is a non-negotiable rule. Successful Morning Star traders write down this rule and review it before every trading session. They create alerts that trigger only after the third candle closes, preventing emotional overrides.
Risk Management emphasizes position sizing that survives inevitable losses. Common Trading Mistakes to Avoid catalogs the emotional patterns that cause traders to abandon winning strategies.
Key Takeaways
- Morning Star patterns are three-candle bullish reversals that signal the transition from selling pressure to buying conviction.
- Candle identification requires a long bearish bar, a small-bodied indecision bar, and a long bullish bar for pattern validity.
- Volume confirmation is critical, and the third candle should close on expanding rather than contracting volume.
- Stop-loss placement should always be set below the lowest point of the three-candle formation to protect capital.
- Higher timeframes such as daily and 4-hour charts provide significantly more reliable Morning Star signals than intraday charts.
- Structural context dictates that the pattern is most effective when it forms at established support levels or moving average averages.
Frequently Asked Questions
This article contains references to Morning Star Candlestick Pattern and Volity, a regulated CFD trading platform. This content is produced for educational purposes only and does not constitute financial advice or a recommendation to buy or sell any financial instrument. Morning Star pattern recognition is subjective and backtesting results may not predict live trading performance. Always test Morning Star strategies extensively on demo accounts before committing real capital. Some links in this article may be affiliate links.