Market volatility represents rapid price fluctuations driven by supply, demand, and investor sentiment shifts. These swift movements create risk through rapid losses, liquidations, and margin calls on leveraged positions. Extreme volatility can wipe out trading accounts when stop-losses are bypassed during gap openings or low-liquidity conditions. Past performance is not indicative of future results. Capital at risk.
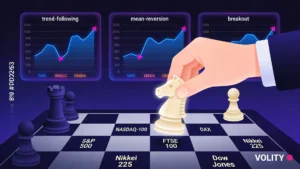
Market volatility identifies the mathematical dispersion of asset returns, representing the degree of price fluctuation within a defined timeframe. In 2026, the global market has entered a “Volatility-Driven” regime characterized by a higher VIX baseline of 16-22 and rapid intraday swings fueled by 0DTE options. By mastering tools like Standard Deviation and the VIX Index, investors can distinguish between temporary market noise and structural regime shifts, allowing for more precise position sizing and risk management.
While understanding Market Volatility Regimes is important, applying that knowledge is where the real growth happens. Create Your Free Forex Trading Account to practice with a free demo account and put your strategy to the test.
Market volatility functions as the essential barometer for investor fear and market liquidity. This methodology identifies periods of price discovery where supply and demand reach new equilibriums, often triggered by macroeconomic shifts or unexpected geopolitical events. It serves as a primary driver for options pricing and active risk-budgeting in 2026.
The 2026 trading environment is defined by a “New Normal” where baseline volatility sits higher than the historical decade average. Investors utilize sophisticated indicators like ATR and Bollinger Bands to navigate a landscape increasingly influenced by high-frequency algorithmic flows and AI-infrastructure spending.
What is market volatility and how is it measured?
Market volatility is a statistical measure of the dispersion of returns for a given security or market index, identifying the level of price uncertainty. This methodology quantifies how far prices deviate from their average, revealing whether an asset exhibits calm, steady movements or wild, unpredictable swings.
Realized Volatility measures what actually happened—the historical price movements recorded over a specific period. Implied Volatility captures what the market expects to happen—the forward-looking estimate embedded in options pricing. Standard Deviation represents the core mathematical tool for quantifying price “spread,” revealing the typical distance of prices from their mean.
In early 2026, the S&P 500 long-run realized volatility has stabilized at 15.8%, while the VIX maintains a higher forward-looking baseline near 19 (CBOE Volatility Data, 2026). This gap signals that institutional traders anticipate more turbulence ahead, making the current 15-16% annualized volatility the 2026 “stable” benchmark for the S&P 500.
Historical vs. Implied Volatility
The realized-versus-implied spread identifies whether option premiums are currently over-pricing or under-pricing the actual risk of market moves. When implied volatility sits above realized volatility, traders view the market as priced for excessive fear. When implied volatility sits below realized volatility, the market is pricing complacency despite actual price swings.
Using historical data for backtesting reveals past patterns and vulnerability zones where markets broke down. Using implied volatility for 2026 pricing reveals what sophisticated option traders believe will happen next, making it the superior indicator for forward-looking position sizing and hedge strategies.
Ready to Elevate Your Trading?
You have the information. Now, get the platform. Join thousands of successful traders who use Volity for its powerful tools, fast execution, and dedicated support.
Create Your Account in Under 3 MinutesUnderstanding the VIX: The “Fear Gauge” of 2026
The VIX Index identifies the market’s expectation of 30-day forward volatility based on S&P 500 options, serving as the primary indicator of global investor sentiment. This index translates abstract fear into a quantifiable number—the percentage change investors are bracing for over the next month.
The 16-22 range now anchors the “New Complacency” floor where 2026 analysts view this zone as neutral and calm. The March 2026 spike to 35.3 during Middle East tensions marked the highest level of market fear since the 2022 energy crisis, identifying how geopolitical shocks immediately trigger volatility spikes. Hedging urgency shifts dramatically above 24, where readings signal a transition from normal stress to high-stress regimes that warrant defensive portfolio adjustments.
The VIX hit an intraday high of 35.3 on March 9, 2026, marking the highest level of market fear since the energy crisis (HeyGoTrade Performance Review, 2026). This peak revealed how quickly sentiment can reverse—from complacency to panic—when unexpected geopolitical events disrupt risk calculations. VIX Index trading became one of the most profitable tactical strategies during this crisis window.
How 0DTE Options Increase Intraday Variance
Intraday variance identifies the extreme price swings that occur within a single trading session, largely driven by the explosive growth of 0DTE (Zero Days to Expiration) options. These instruments—options expiring the same day—force dramatic hedging flows as the market makers adjust to rapid gamma exposure changes.
Hedging flows reveal how market makers must constantly buy or sell the index to stay “Gamma Neutral,” managing the risk that options will swing sharply into the money at expiration. The 3 PM Reversal occurs when 0DTE expirations trigger sharp afternoon “pins” or “fades” as market makers unwind massive hedges at predetermined strike prices. Liquidity risk emerges when short-dated options drain liquidity from the “lit” exchange during crashes, creating temporary gaps where retail orders slip through at unfilled prices.
Real trading example: A trader observed a massive 0DTE call-spread volume at the 5,400 level in February 2026, while the S&P 500 (SPY) was trading at 5,380. The aggressive market-maker hedging forced a “Gamma Squeeze,” pushing the index up 0.8% in just 45 minutes to “pin” at 5,400 for the expiration, demonstrating the power of intraday option flows. The trader who recognized this pattern locked in profits before the 3 PM reversion erased the gains. Past performance is not indicative of future results.
Sector Volatility Benchmarks: Tech vs. Defensive Growth
Sector Beta identify the relative volatility of an industry compared to the broad market, revealing which sectors provide stability during crashes. A Beta of 1.0 matches the S&P 500 exactly, while 0.58 indicates half the volatility and 1.35 indicates 35% more volatility than the broad index.
| Sector | 2026 Avg Beta | March 2026 DD | 2026 Outlook |
| Technology (XLK) | 1.35 | -11.4% | Volatile Growth |
| Utilities (XLU) | 0.58 | -3.1% | Defensive Growth |
| Healthcare (XLV) | 0.72 | -4.8% | Stable Value |
| Energy (XLE) | 1.10 | +14.2% (Q1) | Momentum High |
| S&P 500 (SPY) | 1.00 | -8.7% | Benchmark |
Sources: Morningstar Sector Performance and Fidelity AI Infrastructure Reports (2026)
Utilities have emerged as the unique defensive winner in 2026, experiencing only -3.1% drawdown during the March geopolitical shock while technology dropped -11.4%. This separation reveals how AI infrastructure spending has transformed utilities from passive dividend plays into dynamic growth engines, combining stability with appreciation potential.
The Risks of Volatility Decay and Contango
Contango decay identifies the systematic loss of value in volatility-linked ETFs that occurs when future volatility is priced higher than the current spot level. This decay happens passively—even when the VIX index remains flat, these funds lose 4-9% monthly through structural mechanics.
VXX and UVXY identify as dangerous for multi-week holds because they carry embedded negative roll yield—the cost of continuously selling near-term volatility contracts and buying longer-term ones. The 4-9% monthly drag measures the cost of this “negative roll yield” in 2026, making these instruments unsuitable for traders without active daily management. Strategic alternatives include “Tail-Risk” funds or direct put options instead of volatility ETFs, which provide hedge benefits without the daily decay.
Volatility-linked ETFs are not “Investments”; they are tactical trading tools designed for days, not months. Holding these instruments through a stable market period can result in a 50% loss of capital within six months due to structural time decay and contango.
Turn Knowledge into Profit
You've done the reading, now it's time to act. The best way to learn is by doing. Open a free, no-risk demo account and practice your strategy with virtual funds today.
Open a Free Demo AccountDeveloping a Volatility-Adjusted Trading Plan
Volatility-based position sizing represents the most effective method for maintaining consistent risk exposure across different market regimes. When volatility doubles, position sizes should halve to keep capital at risk constant—a discipline that separates profitable traders from those who blow accounts.
Using ATR (Average True Range) to set stop-losses bases exit prices on recent market activity, not on arbitrary percentage levels. An ATR-based stop 2x the 14-day ATR below entry prevents whipsaws from normal volatility but exits during genuine breakdowns. Scaling Out reduces position size as the VIX crosses above 22, lowering capital exposure when fear surges. Diversification pairs high-vol tech (Nvidia-like stocks) with low-vol safe havens (Gold/Utilities), allowing the portfolio to capture growth during calm periods while limiting damage during crashes.
Portfolio Rebalancing forces discipline by automatically reducing winners and increasing losers—a mechanical approach that outperforms emotional decisions. Stop-Loss Order execution ensures that positions exit at predetermined levels, preventing the human tendency to “hope” for reversals and turn losses into catastrophes.
Key Takeaways
- Market volatility is the primary measure of price uncertainty, quantifying how much and how fast asset prices fluctuate.
- The VIX Index serves as the global “Fear Gauge,” with a 2026 baseline range established between 16 and 22.
- 0DTE options have significantly increased intraday variance, often triggering rapid afternoon price reversals due to market-maker hedging.
- Utilities have emerged as a unique safe haven in 2026, offering price stability while benefiting from AI infrastructure power demands.
- Volatility decay makes long-term holding of volatility ETFs (like VXX) extremely risky, with monthly losses often reaching 4-9%.
- Position sizing should be adjusted based on current volatility levels, using tools like Average True Range (ATR) to set disciplined stop-losses.
Frequently Asked Questions
This article contains references to Market Volatility and Volity, a regulated CFD trading platform. This content is produced for educational purposes only and does not constitute financial advice or a recommendation to buy or sell any financial instrument. Always verify current regulatory status and platform details before using any trading service. Some links in this article may be affiliate links.