Réponse rapide
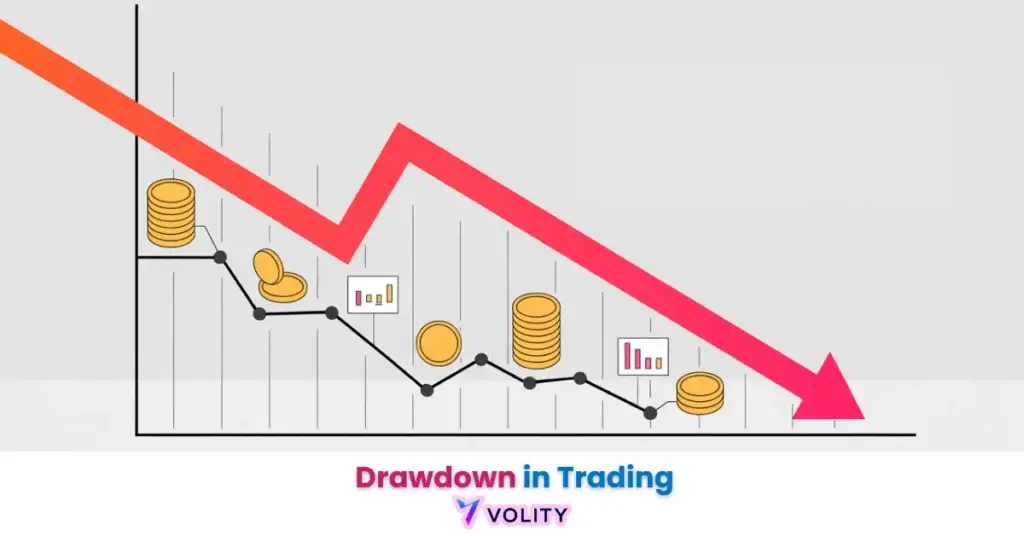
Le drawdown en trading est la baisse depuis un sommet du solde de votre compte jusqu’à un creux ultérieur, mesurée en pourcentage. Il montre combien vous avez perdu par rapport à votre plus haut et constitue un indicateur de risque clé : un drawdown de 50 % nécessite un gain de 100 % pour être récupéré. Gérer le drawdown par le dimensionnement des positions et les stops est ce qui maintient les traders dans la partie.
Les drawdowns (pertes maximales) en trading sont une composante inhérente à toutes les stratégies d’investissement. Un effet de levier excessif augmente considérablement l’ampleur et la durée des drawdowns sur le capital, menant souvent à une perte totale de celui-ci. Ne risquez jamais plus que ce que vous pouvez vous permettre de perdre. Les performances passées ne préjugent pas des résultats futurs. Capital à risque.
Le drawdown en trading est la baisse en pourcentage du sommet au creux des capitaux propres d’un compte avant qu’un nouveau sommet ne soit atteint. Les statistiques du début de l’année 2026 soulignent une volatilité extrême, avec le Bitcoin subissant un drawdown de 52,4 % et le S&P 500 une correction de 18,9 %. Les normes de risque professionnelles de 2026 imposent des plafonds de drawdown quotidien stricts de 3 à 5 % pour les traders des sociétés de prop trading afin d’éviter des écarts de récupération mathématiques catastrophiques.
Le drawdown en trading révèle la mesure la plus précise du risque de baisse et de la viabilité institutionnelle d’une stratégie. Les données actuelles du marché indiquent que le Bitcoin (BTC) a subi une baisse de 52,4 % du sommet au creux entre octobre 2025 et février 2026, illustrant la volatilité extrême inhérente aux cycles des actifs numériques.
La réussite dans la gestion des courbes de capital nécessite d’aller au-delà des simples taux de réussite pour comprendre la difficulté mathématique de se remettre de pertes importantes. Ce guide identifie les principaux types de drawdown, les références institutionnelles de 2026 et les cadres psychologiques nécessaires pour endurer des séries de pertes prolongées.
Comprendre Drawdown in Trading est important, mais la vraie progression commence en appliquant ces connaissances. Créez votre compte de trading forex gratuit pour vous entraîner sur un compte démo gratuit et mettre votre stratégie à l’épreuve.
Ce qu’Alexander Bennett surveille : La gestion du drawdown est plus comportementale que technique pour la plupart des comptes. Trois indicateurs encadrent une pratique durable. Le drawdown historique maximal de la stratégie dans des conditions réelles (non testées sur données historiques) par rapport au drawdown réel que le trader peut tolérer sans abandonner le système ; l’écart entre ces deux chiffres est là où la plupart des comptes échouent. Le drawdown quotidien et hebdomadaire moyen plutôt que le chiffre de pointe seul, car le taux d’érosion du capital est ce qui déclenche l’erreur comportementale. Et le taux de récupération, mesuré comme le temps nécessaire pour atteindre un nouveau sommet de capital après chaque drawdown, ce qui distingue les stratégies qui fonctionnent dans un régime de celles qui se cumulent à travers les régimes. Suivez les trois sur une base continue, fixez des seuils stricts de réduction des risques avant qu’ils ne soient franchis, et les pires erreurs comportementales (trading de vengeance, surendettement lors d’une récupération, abandon du système au plus bas) deviennent plus difficiles à commettre.
Prêt à faire passer votre trading au niveau supérieur ?
Vous avez les connaissances. Il vous manque la plateforme. Rejoignez des milliers de traders qui choisissent Volity pour ses outils puissants, son exécution rapide et son support dédié.
Créez votre compte en moins de 3 minutesQu’est-ce que le drawdown sur le Forex et comment l’effet de levier l’amplifie-t-il ?
Le drawdown sur le Forex est l’érosion rapide des capitaux propres du compte causée par des mouvements de prix mineurs agissant sur des ratios de levier élevés, dépassant souvent 50:1 sur les comptes de détail. Une position standard de 1 lot sur un mouvement de 1,3000 EUR/USD générera un mouvement de 1 000 pips qui se traduit par une perte de compte catastrophique de 10 % sur un compte à levier 1:50, et un appel de marge sur un levier 1:100. Le drawdown flottant fait référence au suivi des pertes non réalisées sur des positions à effet de levier ouvertes ; à mesure que ces pertes s’accumulent, la marge disponible du trader diminue et l’expose à des clôtures forcées au pire moment (Reuters, 2026).
Les déclencheurs d’appel de marge se produisent lorsque le drawdown flottant ajouté aux pertes réalisées réduit les capitaux propres du compte en dessous de l’exigence de maintien du courtier, généralement 10 à 20 % de la taille de la position notionnelle. En mars 2026, la corrélation DXY-Actions a atteint -0,94, ne laissant aux traders que peu d’endroits où se cacher pendant les drawdowns basés sur l’USD, car chaque actif évoluait inversement dans une vente massive synchronisée. Les limites des sociétés de prop trading représentent la norme de l’industrie en 2026 : des plafonds de drawdown quotidien maximal de 3 % et des limites de drawdown maximal total de 8 % empêchent les spirales émotionnelles de « trading de vengeance » qui se transforment en une destruction totale du compte (Hedgeweek, 2026).
stop out et niveaux de marge explique les mécanismes spécifiques de la façon dont l’effet de levier amplifie les petits mouvements en pourcentage en événements de compte catastrophiques.
Quel est un niveau de drawdown sain pour les hedge funds par rapport aux particuliers ?
Un niveau de drawdown sain est un seuil de risque qui varie considérablement entre les hedge funds institutionnels ciblant 1 à 5 % et les traders particuliers qui tolèrent souvent jusqu’à 20 %. Les références institutionnelles révèlent que les hedge funds axés sur l’Asie ont atteint un plafond de drawdown strict de 7,3 % en mars 2026 avant de déclencher une réduction systématique des risques ; cette discipline est ce qui sépare le capital professionnel du jeu de hasard des particuliers. Un drawdown de 15 % persistant pendant 3 mois signale une stratégie « brisée » dans les cercles de détail professionnels car cela indique que la thèse originale est erronée et que le capital devrait être redéployé (JournalPlus, 2026).
Le ratio de Sharpe évalue la qualité de la performance en comparant les rendements à la volatilité du drawdown, pénalisant les stratégies qui génèrent des rendements par une prise de risque excessive. Une stratégie offrant 15 % de rendement annuel avec un drawdown maximal de 40 % (ratio de Sharpe : 0,38) est mathématiquement inférieure à une stratégie offrant 10 % de rendement avec un drawdown maximal de 5 % (ratio de Sharpe : 2,0). Les traders particuliers devraient viser des limites de drawdown maximales inférieures à 15 % pour maintenir leur résilience psychologique, tandis que les traders professionnels visent moins de 5 %.
utilitaire de suivi de backtesting Forex fournit les outils pour analyser les données historiques de drawdown sur votre stratégie de trading.
Comment calculez-vous le pourcentage de drawdown maximal ?
Le calcul du drawdown maximal (MDD) est la mesure quantitative de la plus grande baisse historique en pourcentage depuis n’importe quel sommet de la courbe de capital d’un compte jusqu’à son creux absolu. La formule étape par étape est simple : (Valeur du sommet – Valeur du creux) / Valeur du sommet * 100 = Drawdown %. Si un compte atteint 100 000 $ à son sommet puis tombe à 75 000 $ à son creux, le drawdown est de (100 000 $ – 75 000 $) / 100 000 $ * 100 = 25 % (Technical Analysis Institute, 2026).
Les ratios de Calmar et de Sterling utilisent le MDD pour calculer l’efficacité du rendement ajusté au risque, en comparant le rendement annuel de la stratégie à son drawdown maximal historique. Une stratégie avec un rendement annuel de 20 % et un MDD de 50 % offre un ratio de Calmar de 0,4, tandis qu’une stratégie offrant le même rendement de 20 % avec seulement un MDD de 10 % offre un ratio de Calmar de 2,0. Le ratio plus élevé indique une performance ajustée au risque supérieure et prouve que la deuxième stratégie est mathématiquement supérieure malgré des rendements bruts identiques.
Exemple concret :
Le S&P 500 a atteint un sommet historique en janvier 2026 à environ 5 900. La crise géopolitique qui a suivi en mars 2026 (blocus du détroit d’Ormuz) a déclenché une baisse rapide à 4 800, générant un drawdown de 18,9 % du sommet au creux. La récupération a nécessité une poussée de 11 % fin avril pour commencer la remontée vers le sommet précédent. Les performances passées ne préjugent pas des résultats futurs.
Trouver un avantage de trading cohérent aide les traders à comprendre si leurs stratégies justifient leurs drawdowns historiques par des rendements ajustés au risque supérieurs.
Quelle est la mathématique de la récupération du drawdown et pourquoi est-elle asymétrique ?
La mathématique de la récupération du drawdown est asymétrique car le gain en pourcentage requis pour revenir au seuil de rentabilité augmente de façon exponentielle à mesure que le pourcentage de perte s’aggrave. Une perte de 10 % nécessite un gain de 11,1 % pour récupérer ; une perte de 50 % nécessite un gain de 100 % ; et une perte de 75 % nécessite un gain de 300 % pour revenir au solde initial du compte. Cette asymétrie est la raison pour laquelle la discipline de dimensionnement des positions n’est pas négociable dans le trading professionnel, un drawdown de 50 % est mathématiquement deux fois plus difficile à récupérer qu’un drawdown de 25 %, faisant la différence entre 6 mois et 2 ans de temps de récupération (Vanguard Research, 2026).
Le temps passé en drawdown s’avère souvent plus psychologiquement dommageable que la profondeur du drawdown lui-même. Un trader qui subit un drawdown de 40 % qui dure 2 semaines (suivi d’une récupération rapide) subit beaucoup moins de dommages psychologiques qu’un trader endurant un drawdown de 25 % qui persiste pendant 6 mois. Les disjoncteurs comportementaux, mis en œuvre sous forme de périodes de refroidissement automatisées après une baisse de compte de 5 %, empêchent le sur-trading pendant les périodes émotionnelles où le jugement est compromis (CTA Institute, 2026).
gestion des risques dans le trading Forex couvre les règles spécifiques de dimensionnement des positions et de stop-loss nécessaires pour éviter les drawdowns en cascade.
Transformez vos connaissances en profit
Vous avez lu, il est temps d’agir. La meilleure façon d’apprendre, c’est en pratiquant. Ouvrez un compte démo gratuit et sans risque et entraînez votre stratégie avec des fonds virtuels dès aujourd’hui.
Ouvrir un compte démo gratuitBenchmarks de drawdown par classe d’actifs 2025-2026 (Tableau EAV)
Les références par classe d’actifs révèlent les différences marquées dans le risque de drawdown maximal entre les actions, le forex et la cryptomonnaie au cours du cycle de marché 2026. Les données démontrent que le drawdown de 52,4 % du Bitcoin dépasse largement la volatilité traditionnelle des actions et du forex, ce qui le rend inadapté aux traders averses au risque. Les hedge funds institutionnels maintiennent une discipline de drawdown grâce à un rééquilibrage systématique et à des contraintes de levier, atteignant des niveaux de MDD 3 à 4 fois inférieurs à ceux des traders particuliers (Hedgeweek, 2026).
| Entité | Drawdown Max 2025 | Haut/Bas YTD 2026 | Perspectives 2026 |
| Actions (S&P 500) | -18,9 % | -10,0 % (Correction fév) | Cible < 15 % (Source : Vanguard) |
| Bitcoin (BTC) | -52,4 % | -45,0 % (Oct-Fév) | Creux du cycle près de 57k $ (Source : Galaxy Digital) |
| Forex (Hedge Funds) | -4,3 % | -7,8 % (Sommet mars) | Plafond à 10 % (Source : Hedgeweek) |
| Trader Pro Particulier | -12,0 % | -15,0 % (Limite moy) | « Brisé » si > 3 mois (Source : JournalPlus) |
| Indice Dollar US (DXY) | +1,1 % | +2,2 % (Poussée avril) | Inversement corrélé (Source : Reuters) |
Sources : Vanguard Research, Galaxy Digital, Hedgeweek, JournalPlus, Reuters, 2026
Points clés
- Le drawdown est la baisse en pourcentage du sommet d’un portefeuille à son creux le plus bas, mesurant le risque réaliste d’une stratégie.
- Les statistiques de 2026 indiquent que 50 % des traders particuliers subissent des drawdowns dépassant 30 %, rendant la récupération mathématiquement difficile.
- L' »Asymétrie de la récupération » signifie qu’une perte de compte de 50 % nécessite un gain de 100 % juste pour revenir au solde de départ initial.
- Les sociétés de prop trading professionnelles en 2026 imposent des limites de drawdown quotidien strictes de 3 à 5 % pour éviter les spirales émotionnelles de « trading de vengeance ».
- Le Bitcoin a subi un drawdown massif de 52,4 % début 2026, soulignant la nature à haut risque des positions « long-only » sur les actifs numériques.
- Des indicateurs de risque avancés comme le ratio de Calmar aident à évaluer si les rendements d’une stratégie justifient son drawdown maximal historique.
Foire aux questions
Cet article contient des références au drawdown en trading et à Volity, une plateforme de trading de CFD réglementée. Ce contenu est produit à des fins éducatives uniquement et ne constitue pas un conseil financier ou une recommandation d’achat ou de vente d’un instrument financier. Vérifiez toujours le statut réglementaire actuel et les détails de la plateforme avant d’utiliser un service de trading. Certains liens dans cet article peuvent être des liens d’affiliation.
Volity exploite une plateforme de trading et publie également du contenu éducatif et analytique sur le trading. Le contenu de cette page est uniquement à des fins éducatives et ne doit pas être considéré comme un conseil financier. Volity peut bénéficier commercialement lorsque les lecteurs ouvrent des comptes de trading via les liens présents sur ce site.
Notre contenu est produit et révisé selon des standards éditoriaux documentés ; consultez notre méthodologie de comparaison et de revue.