Investing in financial products involves risk. Losses may exceed the value of your original investment.
Bitcoin scarcity supply is a core topic for traders in 2026. The complete guide follows.
Crypto markets brace for scarcity as Bitcoin hits 20 million milestone
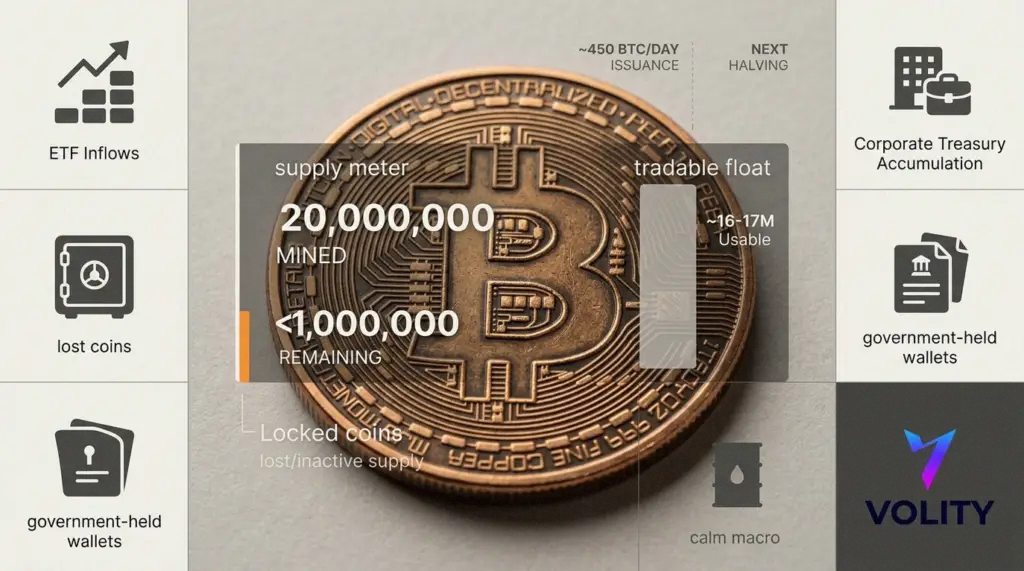
Bitcoin just slipped past a headline number that tends to concentrate minds. More than 20 million coins have now been mined, which means roughly 95% of the hard capped 21 million supply is already out in the world. Meanwhile, the remaining million will dribble out over more than a century, because the issuance schedule keeps tightening like a ratchet.
Therefore, traders are being forced to separate two questions that often get mashed together. First, how scarce is Bitcoin on paper. Second, how scarce is it in practice, once you strip out lost coins, long term hoards and institutional lock ups.
Supply maths gets unforgiving
The network took about 17 years to reach 20 million mined. However, the last million will take until roughly 2140, because each halving cuts new supply again. Daily issuance sits around 450 BTC at present, and it will step down further at the next halving cycle. As a result, price tends to matter more at the margin than narrative does, because fewer new coins arrive to meet fresh demand.
Effective supply looks tighter still. Several chain analytics estimates put permanently lost Bitcoin at 2.3 to 3.7 million coins, through forgotten keys, unspendable addresses and estates that never move. Consequently, the truly usable float may be closer to 16 to 17 million, even before you account for coins parked in cold storage for years.
Big holders keep tightening the float
It is not only early adopters who sit tight. MicroStrategy, now rebranded as Strategy in some market chatter, recently spent $1.28 billion to buy 17,994 BTC. Meanwhile, spot Bitcoin ETFs still pulled in fresh cash in early March, even as Bitcoin wobbled around the high $60,000s.
Strategic stockpiles add another layer. The US government holds roughly 328,000 BTC in seized or controlled wallets. Separately, Satoshi era coins remain untouched in size, with about 1 million BTC associated with the creator’s early wallets. Therefore, more of the supply sits in hands that rarely trade, which can sharpen both rallies and drawdowns.
By the numbers
- 20,000,000+ Bitcoins mined, about 95% of total supply.
- 1,000,000 coins left, expected to be mined through 2140.
- Estimated 2.3 to 3.7 million BTC likely lost, shrinking the real float.
- Current issuance near 450 BTC per day, before the next step down.
- US controlled wallets near 328,000 BTC, largely inactive supply.
Oil whipsaws, Bitcoin shrugs
Macro traders had little time for purity tests this week, because energy markets did their own impression of a meme coin. Crude leapt on Middle East shipping fears, then retraced sharply after talk of a large release hit the tape. As a result, risk markets flashed stress in pockets, with equities wobbling and volatility waking up.
Bitcoin’s reaction was notably restrained. It churned around the mid to high $60,000s, slipping below $66,000 at points, yet avoiding the kind of air pocket that used to follow a macro scare. However, “steady” in crypto often masks a lot of internal rotation, with altcoins and leverage telling a more nervous story than the headline BTC chart.
Altcoin flows hint at a market still trading, not investing
While Bitcoin supply becomes structurally tighter, many traders still look for beta elsewhere. XRP saw whale activity as larger holders accumulated during drawdowns. Meanwhile, Solana continued to post eye catching on chain activity and stablecoin turnover, which keeps it on the tactical watchlist.
However, the backdrop remains fragile for everything outside Bitcoin. Liquidity is thinner, positioning is more crowded and catalysts are less dependable. Therefore, the scarcity story may buoy sentiment, yet it does not eliminate the usual crypto reality that correlations can spike when the tape turns ugly.
What would actually drive the next leg?
Scarcity is not a catalyst on its own. Instead, it is the stage on which catalysts play out. If ETF inflows resume with conviction, fewer freely traded coins could amplify the move. Similarly, if rate cut expectations rise again after soft economic data, risk appetite could return and pull crypto higher.
On the other hand, if energy volatility feeds back into inflation expectations, central banks could stay restrictive for longer. In that case, Bitcoin may hold up better than frothier tokens, yet it would still have to fight for new marginal buyers at higher prices.
Key takeaways
- Watch issuance, not mythology: fewer fresh coins means flow data matters more.
- Track ETF and corporate buying: they remove float and can steepen rallies.
- Mind macro shocks: oil driven inflation scares can cap risk across the board.
- Separate BTC from alts: scarcity supports Bitcoin, yet alts still trade like leveraged risk.
- Volatility can rise on “good” news: a tight float can also mean sharper liquidation cascades.
For more on this topic see our deep-dives on Bitcoin ETF Inflows and XRP Leverage: Reading Crypto Flow Signals, Crypto Market Today: Bitcoin Options Expiry Risks Explained, and Bitcoin Bounce, Bybit-UBS Tokenized Bond, Stablecoin Surge Explained.
What our analysts watch: Three lenses dominate our reading of the equity tape. Sector rotation tells us where capital is moving (defensives versus cyclicals, value versus growth). Earnings revisions show whether analyst expectations are catching up to or trailing reality. Real yields and the dollar set the discount rate that valuation multiples respond to. When earnings estimates rise faster than the index price and real yields stabilise, the setup tends to favour patient longs.
Frequently asked questions
How much money do I need to start trading stocks?
Many regulated brokers now allow account opening with no minimum deposit and offer fractional shares for as little as $1. A practical starting balance for a long-only beginner is $500 to $2,000, enough to diversify across a handful of positions without paying meaningful percentage spreads. The FCA publishes investor education resources worth reading before opening an account.
What is the difference between stocks, ETFs, and CFDs?
A stock is direct ownership in a company. An ETF is a basket of stocks (or other assets) traded as a single security. A CFD (contract for difference) is a leveraged derivative that tracks the underlying price without conferring ownership. Each has different cost, tax, and risk profiles. ESMA imposes leverage caps on retail CFDs in the EU and UK.
How do I choose a trustworthy broker?
Verify regulation with a tier-one authority (FCA in the UK, CySEC in Cyprus, BaFin in Germany, ASIC in Australia, or your local regulator). Check segregated client funds, negative-balance protection, transparent fees, and a clean disciplinary record. Avoid any platform offering guaranteed returns or pressuring deposits. The FCA Financial Services Register is free to search.
Should I day-trade or invest long-term?
Most retail accounts that day-trade lose money over time. Long-term passive investing in diversified index ETFs has historically delivered competitive returns with far less effort and lower stress. Active day-trading can work, but it requires capital, an edge proven over hundreds of trades, and the time to monitor positions intraday. Start passive; layer active only after the basics are durable.
Related guides
- Bitcoin explained
- Ethereum explained
- Cryptocurrency trading
- Best crypto investments
- Best trading platforms
Alexander Bennett, Volity research: The Volity desk runs a three-layer supply model on every BTC cycle review. Layer one is the issued supply against the cap. Layer two is the estimated permanently lost coins, where chain-analytics consensus puts the number between 2.3 and 3.7 million. Layer three is the institutional lockup floor, where ETF custodied coins plus disclosed corporate treasuries plus long-term-holder cohorts behave as effectively dormant float. Net of those three layers, the marginal-buyer arithmetic looks materially tighter than the headline supply figure suggests.
Volity analyst FAQ
How many bitcoins are actually in circulation?
More than 20 million coins have been mined against the 21 million hard cap, but circulating supply available for active trading is materially smaller once permanently lost coins, long-term holder cohorts, and ETF custodial holdings are subtracted. Chain-analytics estimates put effective float closer to 14 to 16 million. The Investopedia Bitcoin primer covers the canonical supply schedule.
What is the next Bitcoin halving and why does it matter?
Each halving cuts the block subsidy in half, reducing daily issuance and tightening the marginal supply that meets daily demand. The historical pattern shows price strength asymmetric to halving timing, though the relationship is correlation rather than causation. The BIS research on cryptoassets covers the academic framing of scheduled-supply dynamics.
How do spot Bitcoin ETFs affect scarcity?
Spot ETFs custody actual BTC against shares, which removes coins from active float as long as the fund holds the position. Net positive flows therefore tighten effective supply at a faster rate than the issuance schedule. Net negative flows release coins back into the float. The signal worth tracking is multi-week net flow, not single-day prints. The CoinDesk Bitcoin reference aggregates flow alongside price.
Will Bitcoin scarcity actually drive price higher?
Scarcity sets the supply curve, but price requires demand against that curve. The honest framing is that scarcity is a necessary condition for the long-term thesis, not a sufficient one. When sticky institutional demand meets a tightening float, the price-sensitivity argument compounds. When demand fades, scarcity alone does not levitate the price. Both halves of the equation must be present.
External references
- Investopedia Bitcoin primer
- BIS research on cryptoassets
- CoinDesk Bitcoin price
Volity operates a trading platform and also publishes educational and analytical content about trading. The content on this page is for educational purposes only and should not be considered financial advice. Volity may benefit commercially when readers open trading accounts through links on this site.
Our content is produced and reviewed under documented editorial standards; comparison and review methodology is published here.