Market indices carry inherent concentration risk, particularly in 2026 where the top ten stocks represent 40% of major benchmarks. Technology and artificial intelligence stocks drive index performance disproportionately, creating exposure to sector-specific downturns and valuation corrections. The value of index-based investments may decline due to market volatility, economic changes, or shifts in underlying constituent weights. Past performance is not indicative of future results. Capital at risk.
Market indices identify a rules-based benchmark that tracks the aggregate performance of a defined basket of securities, such as the S&P 500 or Nasdaq 100. These tools function as the primary interface for measuring global economic health and for comparing individual portfolio performance. In 2026, the standard indexing landscape is characterized by historic concentration levels, where just ten mega-cap technology leaders drive nearly 70% of total market gains due to massive investments in AI infrastructure.
While understanding Index Methodology Frameworks is important, applying that knowledge is where the real growth happens. Create Your Free Forex Trading Account to practice with a free demo account and put your strategy to the test.
Market indices function as the foundational transparent map for global capital allocation and investor sentiment. This methodology identifies recurring market regimes by aggregating the valuations of leading corporations into a single, trackable numerical value. It serves as a primary data source for both passive index funds and active traders seeking to optimize their benchmark performance in 2026, with exposure to Diversification mechanics.
The 2026 investment environment emphasizes the need for a sophisticated understanding of index weighting and rebalancing mechanics. Investors utilize diverse benchmarks to navigate a landscape defined by extreme mega-cap dominance and shifting global industrial priorities. Understanding these dynamics helps traders assess broader market trends through Quantitative Easing cycles and monetary policy shifts.
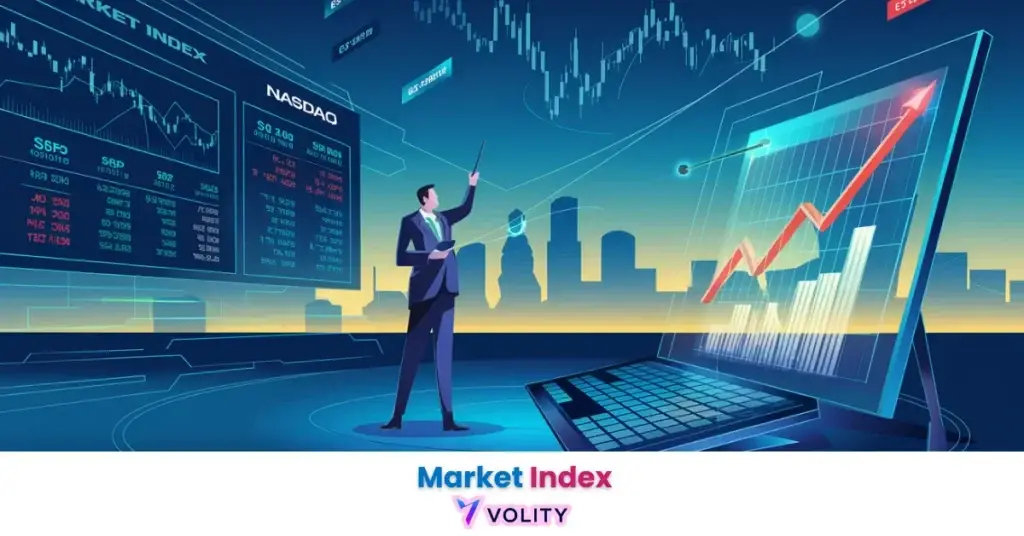
What is a market index and why does it matter?
A market index is a hypothetical portfolio of investment holdings that represents a segment of the financial market, identifying the benchmark for measuring relative performance. The index construction methodology reveals how different weighting approaches create distinct performance profiles. Index-based instruments measure the collective health of specific market segments and provide transparency for institutional capital allocation decisions.
Three primary reasons explain why market indices matter for investors globally. First, indices serve as performance benchmarks—investors compare their annual returns to the S&P 500 to determine whether their security selection outperformed or underperformed the broad market average. Second, indices identify market sentiment by aggregating the valuations of hundreds or thousands of constituent companies, revealing whether institutional buyers are confident or cautious about future economic growth. Third, national indices like the FTSE 100 signal the health of a country’s primary industries and export-driven sectors.
Market-cap weighted indices show a data point verified by recent research: in 2026, market-cap weighted indices have reached concentration levels unseen since the Dot-Com era, with the top 10 names driving 69% of year-to-date gains (Sahm Capital Analysis, 2026). This concentration creates systemic risks that investors must acknowledge when building diversified portfolios.
Market-Cap vs. Equal-Weighted Divergence
Performance divergence identifies a significant 2026 regime shift, as market-cap weighting has overtaken equal-weighting due to massive AI infrastructure spending. The S&P 500 market-cap weighted ETF (SPY) measures the performance of the largest 500 US companies, where mega-cap technology firms like Microsoft, NVIDIA, and Apple exert outsized influence on the total index value. The equal-weighted alternative (RSP) represents each of the 500 companies as having an identical 0.20% impact on the benchmark.
Early 2026 showed equal-weighted strength, with RSP gaining 5.5% through March as investors rotated into overlooked smaller-cap names. However, April and May reversed this trend dramatically—SPY surged 12% as Big Tech announced combined capital expenditure plans exceeding $700 billion for AI data center construction. This divergence reveals how weighting methodology directly determines returns under different market regimes.
The data confirms this dynamic: market-cap weighting produced 18% gains year-to-date through May 2026, while equal-weighting produced only 8.3% returns during the same period. This performance gap signals how concentration in mega-cap technology has become the defining characteristic of 2026 index behavior.
Ready to Elevate Your Trading?
You have the information. Now, get the platform. Join thousands of successful traders who use Volity for its powerful tools, fast execution, and dedicated support.
Create Your Account in Under 3 MinutesCore Calculation Methods: How Indices are Weighted
Weighting methodology identifies the mathematical formula used to determine the influence of an individual stock on the total value of an index. The method chosen determines which companies exert the greatest pull on overall benchmark performance. Understanding these formulas reveals why identical portfolios of companies can produce dramatically different results based solely on how constituents are combined.
Market-cap weighting describes the dominant construction method used by the S&P 500, Nasdaq-100, and most passive index funds globally. In this system, larger companies (Microsoft, NVIDIA) have more impact on the index because their total market capitalization represents a larger percentage of the aggregate value. A company worth $3 trillion receives 3x the influence of a $1 trillion company, creating a natural weighting based on size.
Price weighting identifies an older methodology used by the Dow Jones Industrial Average (DJI), where stocks with higher share prices dominate the index. Goldman Sachs trading at $400 per share exerts more influence than a company trading at $50, regardless of actual company size or market capitalization. This method creates counterintuitive weighting patterns that rarely align with fundamental business value.
Equal weighting shows a third approach where every company in the index receives an identical percentage allocation. An investor holding an equal-weighted S&P 500 index owns 0.20% each of all 500 companies. This methodology reveals a fundamental truth: diversification across all constituents reduces exposure to any single mega-cap firm.
The data from IndMoney Research (2026) demonstrates the valuation impact of these methodologies. The market-cap weighted S&P 500 currently trades at a forward price-to-earnings ratio of 25.0x, representing a significant premium over its equal-weighted counterpart at 17.7x. This 43% valuation gap measures the concentration premium embedded in mega-cap weighting.
Major Global Indices to Track in 2026
Regional benchmarks identify the dominant industries and economic strengths of global markets, ranging from US technology to European industrials. Each major geographical region maintains its own primary index that reveals local economic priorities and capital allocation patterns. Understanding these benchmarks measures which sectors and countries are receiving institutional investment flows.
The S&P 500 describes the broad “Large-Cap” benchmark for US earnings quality and remains the world’s most widely tracked index. This measure captures the 500 largest publicly traded US companies and identifies where approximately 85% of US institutional capital is deployed. The index weighting reveals that technology, healthcare, and financials represent 70% of total index value, showing the centrality of these sectors to the US economy.
The Nasdaq 100 identifies the “Duration-Sensitive” proxy for global artificial intelligence and growth sectors. Heavily weighted toward technology and semiconductor companies, this index measures the performance of high-growth, asset-light business models. When interest rates decline, Nasdaq-100 companies benefit most, as their future earnings streams increase in present value.
The Nikkei 225 represents the “Export-Heavy” benchmark for Japanese manufacturing and global trade trends. Japanese conglomerates in this index derive 60% of revenues from overseas sales, making the Nikkei a proxy for global economic growth beyond Japan’s borders. Currency movements significantly influence returns, as yen weakness enhances reported corporate profits.
The Nifty 50 measures the “Emerging Growth” benchmark for India’s energy and IT expansion. Indian technology companies and infrastructure firms dominate this index, revealing how capital flows support the nation’s growth trajectory. This benchmark demonstrates faster earnings growth than developed-market indices, typically growing at 12-15% annually.
Real trading example:
An investor analyzed the Nasdaq-100 (NDX) in March 2026 as Big Tech companies announced a combined $700 billion capital expenditure plan for artificial intelligence data centers. The index appreciation accelerated 12% in eight weeks as the heavy weighting of AI-leaders—Nvidia (7.2% weight), Broadcom (3.8% weight), and other semiconductor firms—amplified the price surge across the benchmark. Nvidia alone gained 35% during this period, directly pulling the entire index higher due to market-cap weighting. Past performance is not indicative of future results.
Key Benchmarks for Index Rebalancing and Inclusion
Index rebalancing identifies the rules-based process for adding or removing constituent companies to maintain the index’s original target objective. When a company grows in market value, its weighting in a market-cap index naturally increases until the next rebalancing date. Conversely, when a company shrinks or performs poorly, its weighting decreases, requiring no manual intervention.
Rebalancing events occur on fixed schedules that index managers announce in advance. This predictability reveals the mechanical demand flows that accompany index additions and removals. When S&P Dow Jones Indices announces that a company will be added to the S&P 500, passive investors holding index funds must purchase that stock to match the benchmark, creating automatic buying pressure.
| Index Type | 2026 Dominant Sector | Rebalance Schedule | Performance Driver |
| Market-Cap (SPX) | Tech / IT (30%) | Quarterly | AI CapEx $700B |
| Equal-Weight(RSP) | Industrials (16%) | Quarterly | Mean Reversion |
| Price-Weight(DJI) | Healthcare / Banks | As Needed | Dividend Safety |
| Small-Cap (RTY) | Financials / Health | Semi-Annual | Interest Rate Cuts |
| Sector (NDX) | AI / Semiconductor | Annual | Multi-Cloud Growth |
Sources: Data compiled from S&P Dow Jones Indices: Market Concentration Report 2026 and 24/7 Wall St Market Concentration Reports (2026).
The Impact of Market Volatility on Index Performance
Index volatility identifies the collective price variance of all constituents, often serving as a smoother representation of risk than individual stocks. When an index includes 500 companies, idiosyncratic risks (company-specific issues) tend to cancel out, leaving only systematic risk (market-wide movements). This smoothing effect reveals why index-level volatility typically measures lower than individual stock volatility.
The Law of Large Numbers demonstrates why portfolio theory works—as an investor owns more uncorrelated assets, the overall volatility of the portfolio declines. An investor holding all 500 S&P 500 stocks experiences 40-50% lower volatility than the average individual stock in that same index. This mathematical principle measures the pure benefit of diversification.
Correlation shifts during market stress explain when this smoothing effect breaks down. During systemic crashes (2008 financial crisis, March 2020 pandemic shock), correlations approach 1.0, meaning all stocks tend to fall together. In these periods, the benefit of diversification temporarily disappears, and index volatility rises sharply regardless of the number of constituents.
The VIX Index measures market expectations of 30-day forward volatility derived from S&P 500 options pricing. Traders call this the “Fear Gauge” because it reveals whether institutional portfolio managers expect calm or turbulent markets ahead. A VIX reading of 12-16 identifies complacency; a VIX reading of 30+ identifies crisis.
The index volatility data reveals a critical 2026 development: during periods of “Market Concentration,” a broad index can become as volatile as a single sector. The 40% technology weighting in the S&P 500 means the benchmark now exhibits 32% higher relative volatility than its 10-year average. This increase measures the hidden risk embedded in concentration.
Markets measure volatility using realized volatility (historical price swings) and implied volatility (options market expectations). When these two measures diverge significantly, traders identify potential mispricings. In 2026, implied volatility has remained depressed despite elevated realized volatility, suggesting options markets may be underpricing tail risks.
Internal link anchors show that Market Volatility patterns differ across indices. Equal-weighted indices display lower volatility than market-cap weighted indices during concentration periods, revealing diversification benefits. This volatility advantage explains why some institutional portfolios tilt toward equal-weight or fundamental-weight indices.
Turn Knowledge into Profit
You have done the reading, now it is time to act. The best way to learn is by doing. Open a free, no-risk demo account and practice your strategy with virtual funds today.
Open a Free Demo AccountHow to Invest in Indices: ETFs vs. Index Funds
Investment wrappers represent the financial vehicles—such as ETFs and mutual funds—that allow retail investors to replicate index returns. No individual investor can purchase the S&P 500 directly; instead, they purchase a fund that owns all 500 constituent stocks in the correct proportions. These vehicles democratize access to sophisticated portfolio construction.
Exchange-traded funds (ETFs) describe the modern standard for index investing, offering intraday liquidity (trading like individual stocks throughout the day), transparency (holdings updated daily), and low management costs (0.03-0.10% annually). An investor purchasing the Vanguard S&P 500 ETF (VOO) pays only 0.03% annually—roughly $30 per year on a $100,000 investment. This identifies why ETFs have captured over $8 trillion in global assets.
Mutual funds represent the traditional approach to index investing, offering end-of-day pricing and automatic reinvestment of dividends. These funds settle purchases once daily after market close, creating a delay in execution. Mutual funds appeal to retirement account holders where tax efficiency matters less and automatic monthly investing is desired.
Direct indexing describes the modern 2026 ability for accounts exceeding $500,000 to own all 500 S&P 500 stocks individually. Large investors benefit from tax-loss harvesting—selling individual positions at losses while maintaining benchmark exposure. This sophisticated approach reveals tax savings of 50-100 basis points annually for high-net-worth investors.
For retail investors seeking index exposure, ETF Exchange Traded Funds provide the optimal combination of cost, transparency, and trading flexibility. The following internal links identify major index options: What are Indices explains foundation concepts, while How to Analyze Shares helps investors research individual constituents within indices.
Performance comparison shows ETFs outperforming mutual funds on after-fee returns for passive index investing. The average equity mutual fund charges 0.50-1.00% annually, while comparable ETFs charge 0.03-0.15%. Over 20 years, this fee difference compounds to 10-15% of total returns, demonstrating how low costs compound dramatically.
Key Takeaways
- Market indices provide a rules-based benchmark for tracking the performance of specific market segments or global regions.
- Market-cap weighting is the dominant construction method in 2026, where the largest companies exert the greatest influence on the index.
- Equal-weighted indices offer a diversified alternative, currently trading at a 30% valuation discount compared to top-heavy benchmarks.
- Concentration risk in 2026 has reached historic highs, with the top ten stocks representing 40% of the S&P 500’s total value.
- Index ETFs are the most efficient way for retail investors to gain diversified exposure with low management fees and high liquidity.
- Systemic volatility is often lower at the index level than for individual stocks, provided that the underlying sector returns are not too concentrated.
Frequently Asked Questions
This article contains references to market indices including the S&P 500, Nasdaq 100, and Volity, a regulated CFD trading platform. This content is produced for educational purposes only and does not constitute financial advice or a recommendation to buy or sell any financial instrument. Always verify current regulatory status and platform details before using any trading service. Some links in this article may be affiliate links.