Non-Farm Payroll releases trigger extreme volatility in gold, currencies, and equity indices during the first hour of trading. Leveraged positions can face rapid margin calls when price gaps through a level. Stop-losses are frequently bypassed before execution, leaving traders with massive slippage losses. Government economic data surprises create cascading liquidations across correlated assets. Past performance is not indicative of future results. Capital at risk.
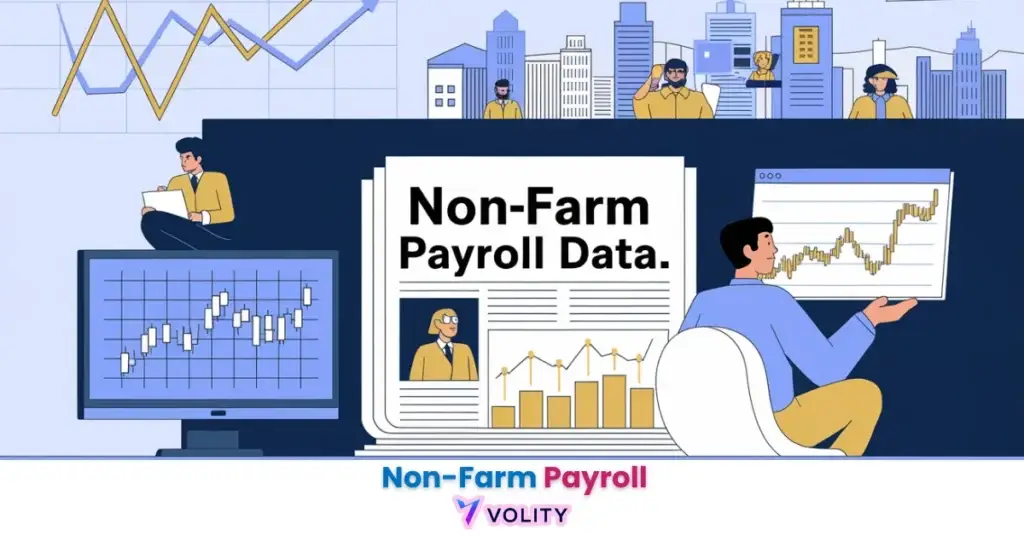
The Non-Farm Payroll (NFP) report identifies the total number of paid U.S. workers excluding farm employees, government officials, and private household staff. Released monthly by the Bureau of Labor Statistics, it is the most closely watched read on the labour market behind Federal Reserve interest rate decisions, and the gap between the headline number and the forecast is what triggers the intraday volatility traders see in gold, the dollar and equity indices.
While understanding NFP Economic Indicators is important, applying that knowledge is where the real growth happens. Create Your Free Forex Trading Account to practice with a free demo account and put your strategy to the test.
Non-Farm Payroll functions as the most anticipated economic data release for traders and institutional allocators in 2026. This methodology identifies the strength of consumer demand and industrial production by measuring net hires across the US economy. It serves as a primary driver of the “8:30 AM Volatility” seen in Gold, Treasury yields, and major currency pairs.
Traders read the release for the direction of hiring and the direction of pay together, because the two lines can point opposite ways and it is the combination, not the headline alone, that sets the rate expectation.
What is the Non-Farm Payroll (NFP) report?
The Non-Farm Payroll report is a monthly employment survey published by the Bureau of Labor Statistics (BLS) that counts the number of jobs created or lost in the US economy. This report represents the most direct measurement of labor market health and serves as the primary signal for Federal Reserve monetary policy adjustments.
Component analysis reveals three critical figures: Payroll gains measure net new jobs, the Unemployment rate tracks joblessness, and Average Hourly Earnings (AHE) reveals wage pressure. Excluded categories include farm workers, private household staff and the unincorporated self-employed. The release lands on the first Friday of most months at 8:30 AM Eastern, and traders spend the preceding week positioning for it.
What matters for the trade is the direction of travel rather than any single print. A run of slowing monthly gains reads as either a cooling that the Federal Reserve can respond to or the leading edge of a downturn, and the market spends the following weeks arguing about which one it is. Read the headline against the revisions to the two previous months before you decide.
The “Dual Mandate” and Fed Policy
Federal Reserve policy treats the payroll report as a primary read on the employment half of its dual mandate. The other half is price stability, which the Federal Open Market Committee defines as inflation of 2 percent over the longer run. When hiring and inflation point different ways, the committee has to choose which side to lean against, and that choice is what the market trades. The committee meets eight times a year on a published calendar, so a payroll print is read against the next scheduled decision.
How strong jobs data triggers higher interest rate expectations becomes clear when robust NFP numbers exceed forecasts by 50,000+, traders immediately price in additional rate hikes. The “Bad News is Good News” paradox emerges during inflation spikes, where weak jobs data paradoxically rallies stocks because it signals relief from further Fed tightening.
Ready to Elevate Your Trading?
You have the information. Now, get the platform. Join thousands of successful traders who use Volity for its powerful tools, fast execution, and dedicated support.
Create Your Account in Under 3 MinutesUnderstanding the 2026 NFP Benchmarks
Labour market benchmarks describe the range of job creation that supports growth without pushing wages up faster than prices. There is no official number for it, which is exactly why forecasters disagree and why the release moves markets at all.
Nominal wage growth can look healthy while real wage growth is negative, because the comparison that matters is pay against prices rather than pay against last year. The sector table underneath the headline is worth the same attention, since hiring is rarely spread evenly across the economy.
Where the losses concentrate matters as much as the total. A month in which one sector sheds jobs while the rest hires reads very differently from a broad contraction, and the payroll report breaks this out by industry. Economic Indicators work together to tell a more complete economic story than NFP alone.
How to Trade NFP: Gold and the US Dollar
Market reaction analysis identifies the negative correlation between the US Dollar and Gold during the immediate 30-minute window following the NFP release. Weak jobs data sends capital fleeing to safe-haven assets, while strong jobs data triggers dollar demand.
Trading the “miss” is the common expression of that: weak jobs data sends gold higher as traders price in rate cuts. The Dollar Reflex occurs when strong jobs data triggers immediate buying in USD/JPY and sell-offs in EUR/USD. Intraday volatility peaks in the first 15 minutes, where 1-minute charts show extreme price action followed by mean reversion.
What a “double miss” looks like: the headline comes in under forecast and average hourly earnings are flat at the same time. Rate-cut expectations move, the dollar softens and gold tends to rise within the same few minutes. The size of the move depends on how far the print sits from consensus, not on the headline in isolation. Past performance is not indicative of future results.
The Impact of AI and Automation on NFP Interpretation
AI-driven displacement identifies the growing gap between industrial output and human labor requirements in the 2026 economy. Traditional NFP models assume that job creation measures economic health, but when jobs are being replaced by artificial intelligence, the metric becomes misleading.
| Line in the release | What it measures | Why traders watch it |
| Headline payrolls | Net change in jobs outside farming, from the establishment survey | It is the number the forecast is set against, so the gap to consensus drives the first move |
| Unemployment rate | Share of the labour force without work, from the separate household survey | It can move the opposite way to payrolls, because the two surveys are independent |
| Average hourly earnings | Change in pay per hour, month on month and year on year | It is the wage-inflation read, and it often decides the direction after the first spike |
| Participation rate | Share of the working-age population in work or looking for it | It explains an unemployment rate that fell because people left the labour force |
| Revisions | Restated figures for the two preceding months | A large revision can reverse the read on the headline within seconds |
The lines above are the standing components of the release, not a forecast of any month.
Automation muddies the read, because rising unemployment can now sit alongside rising output. The payroll report counts jobs, not the work the jobs used to do, so a falling headline does not always mean a weakening economy.
Macro Risks: Tariffs and Energy Shocks
Small business hiring is the part of the report most exposed to input costs. When tariffs or energy prices raise the cost of materials, smaller firms tend to freeze hiring before larger ones do, and that shows up in the establishment survey first.
High fuel prices reduce transport and logistics hiring, making fuel-dependent industries cautious about new payroll. A negative headline is the reading that raises recession talk, particularly when it follows downward revisions to the months before it.
Phantom job gains plague 2026 reports, which often show strength in part-time roles while full-time professional positions continue to contract. This composition shift indicates potential overestimation of labor market health, the employment statistics hide a deteriorating quality of work.
Turn Knowledge into Profit
You have done the reading, now it is time to act. The best way to learn is by doing. Open a free, no-risk demo account and practice your strategy with virtual funds today.
Open a Free Demo AccountStep-by-Step: Preparing for an NFP Release
Strategic preparation represents the most effective method for protecting capital during the extreme volatility of NFP Friday. Pre-planning prevents panic decisions that destroy accounts during chaotic market conditions.
Checking the economic calendar means verifying the consensus vs. previous numbers to understand surprise probability. Position sizing requires reducing leverage to 50% of normal levels during the release window, protecting against gap-risk liquidations. The “Wait and See” strategy means entering after the first 15 minutes to avoid being caught in “fake-outs”, initial price spikes often reverse within 20 minutes.
Market Volatility peaks at 8:30 AM EST, making this the highest-risk window in the monthly calendar. Stop-Loss Order discipline is critical to ensure predetermined exit prices execute before slippage destroys the intended risk-management plan.
Key Takeaways
- Non-Farm Payroll is the most important monthly economic release, tracking net job creation in the United States excluding the agricultural sector.
- Market volatility spikes instantly at 8:30 AM EST on NFP Fridays, affecting Gold, the US Dollar, and major stock market indices.
- The headline is read against consensus and against the revisions to the two previous months, not on its own.
- Automation makes the report harder to read, because job losses can now sit alongside rising output.
- Average hourly earnings matter as much as the headline, since the Federal Open Market Committee targets inflation of 2 percent over the longer run.
- Trading the miss is a common NFP strategy, where weaker-than-expected jobs data typically leads to a surge in Gold and a drop in the US Dollar.
Frequently Asked Questions
This article contains references to Non-Farm Payroll and Volity, a regulated CFD trading platform. This content is produced for educational purposes only and does not constitute financial advice or a recommendation to buy or sell any financial instrument. Always verify current regulatory status and platform details before using any trading service. Some links in this article may be affiliate links.