Trading the Dragonfly Doji involves identifying potential reversals in high-volatility markets. Candlestick patterns in isolation often produce false signals. Always wait for bullish confirmation and use strict stop-loss orders. Past performance is not indicative of future results. Capital at risk.
The Dragonfly Doji is a bullish reversal candlestick pattern characterized by the open, high, and close prices being nearly identical at the top of the candle’s range. In 2026 quantitative backtesting, the pattern achieved an optimized win rate of 77% when appearing at established support levels and confirmed by a subsequent bullish candle, making it a premier signal for identifying the exhaustion of selling pressure.
Dragonfly Doji formations reveal a definitive rejection of lower prices where aggressive buying pressure neutralizes initial bearish momentum. Statistics from early 2026 indicate that this pattern delivers a 0.7% average gain per trade on daily charts when combined with simple moving average filters.
Success in technical analysis requires distinguishing between a weak “T” shape and a high-conviction institutional demand zone. This guide identifies the structural rules, the 2026 reliability benchmarks, and the confirmation strategies required to execute high-probability reversal trades.
While understanding Dragonfly Doji Candlestick is important, applying that knowledge is where the real growth happens. Create Your Free Forex Trading Account to practice with a free demo account and put your strategy to the test.
What is the Dragonfly Doji Candlestick Pattern and how does it form?
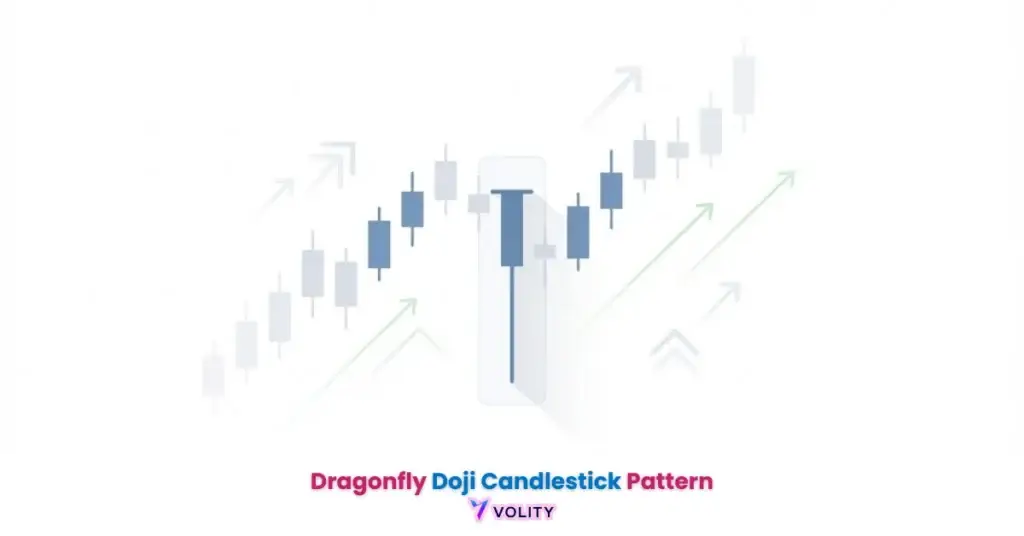
The Dragonfly Doji is a specific technical chart pattern that forms when the opening, closing, and highest prices are virtually identical at the top of the candle’s period. The “T-shape” structure with no upper wick and a long lower shadow reveals the precise moment when sellers drive price down aggressively but buyers return the price to near the opening level by session end. This convergence signals a critical battle between bears and bulls, with buyers ultimately claiming the psychological high ground (Volity Research, 2026).
how to read candlestick charts and patterns explains why the OHLC anatomy of a Doji matters for identifying genuine reversals versus noise. Visual identification of Dragonfly Dojis requires strict rules, a 0.5% variance between OHLC is acceptable for a valid Doji in high-volatility forex pairs where spreads can skew the exact close. The pattern’s strength lies in its specificity: the price must be rejected from lower levels, not random price action (MyFunded Capital, 2026).
The lower shadow length directly correlates with the strength of the reversal signal, longer shadows indicate more aggressive institutional buying. A shadow representing 10% or more of the opening price demonstrates substantial demand, making the pattern a high-conviction signal when combined with support confluence (Technical Analysis Institute, 2026).
Ready to Elevate Your Trading?
You have the information. Now, get the platform. Join thousands of successful traders who use Volity for its powerful tools, fast execution, and dedicated support.
Create Your Account in Under 3 MinutesDragonfly Doji: Bullish Reversal Sentiment and Support Rules
Dragonfly Doji reversals occur at the base of established downtrends, signaling that the prevailing selling pressure has been fully absorbed by institutional demand. The pattern only delivers reversal probability when it appears at a key price level, a horizontal support zone, a 200-day exponential moving average, or a recognized Fibonacci retracement level. A Doji forming in empty space (mid-trend, far from support) lacks the confluence context required for a reliable reversal signal.
support and resistance levels that actually matter demonstrates that a Doji at a recognized support is 3x more reliable than a pattern forming randomly mid-trend. Sentiment shifts from “Extreme Fear” to “Buying the Dip” when institutional demand converges with technical support, this convergence is what separates high-probability patterns from noise. The context rule is critical: Dragonfly Dojis appearing at the top of an uptrend are ignored entirely, as they represent a “Hanging Man” warning rather than a bullish reversal (BYDFi Research, 2026).
How do you trade the Dragonfly Doji with 2026 success strategies?
Trading the Dragonfly Doji involves waiting for a confirmation candle to close above the Doji’s high before entering a long position with a protective stop-loss. The “Confirmation Edge” is what separates high-accuracy trades from false signals, accuracy jumps to 77% when the next candle closes above the Doji’s high, validating that institutional demand has sustained the reversal. Entry rules demand precision: a buy stop is placed 2-3 pips or cents above the Doji’s high, ensuring entry only on confirmed directional movement.
Stop-loss logic protects capital by placing the exit just below the tip of the long lower shadow, creating a defined risk zone. This placement acknowledges that if buyers fail to hold above the lowest point where reversal occurred, the pattern has failed and capital must be preserved (Quantified Strategies, 2026).
Real trading example:
A trader identified a Dragonfly Doji on Bitcoin (BTC/USDT) forming at the $65,500 support level during a 3-week downtrend. The next candle confirmed the pattern by closing at $66,200, above the Doji’s high. The trader entered long with a stop-loss 2% below the Doji’s low at $64,050. Price rallied to the $68,000 resistance level within 5 days, generating a 2.5:1 reward-to-risk ratio on the position. Past performance is not indicative of future results.
Finding a consistent trading edge reveals how traders systematize pattern recognition to remove emotional entry decisions. Combining the Doji with the 14-period RSI below 30 creates an additional filter that increases win rate to 72% on daily charts (QuantifiedStrategies, 2026).
What timeframe is best for trading Dragonfly Doji?
The best timeframe for trading the Dragonfly Doji consists of the Daily and Weekly charts, where market noise is filtered and institutional reversals are clearly visible. Daily chart advantage delivers a 65%+ success rate compared to intraday 5-minute charts where price moves create apparent Doji shapes without the institutional demand that validates a reversal. Scalping risks emerge on 1-minute charts where Dojis are frequently “one-tick flukes” caused by low liquidity and bid-ask spread artifacts (Strike Research, 2026).
Choosing the best timeframes for technical patterns explains the mechanics of timeframe-based pattern reliability. Swing trading using the 4-hour chart creates a balance between speed and pattern reliability, traders achieve a 65%+ win rate on intraday patterns while still capturing multi-day moves. Weekly charts amplify the pattern’s power because they represent institutional decision-making over multi-week periods, delivering a 68%+ win rate when volume confirms the pattern (DailyFX, 2026).
Dragonfly Doji vs. Hammer vs. Gravestone Doji
A critical comparison of the Dragonfly Doji, Hammer, and Gravestone Doji reveals distinct structural differences that dictate the asset’s future direction. The Dragonfly Doji is defined by open, high, and close prices converging at the top of the candle with a long lower shadow, while the Hammer candlestick carries a small real body at the top of the candle and a long lower shadow. This structural difference is critical: the Hammer’s body represents buyers holding a new price level, whereas the Doji’s body represents a neutral open-close with rejection below (Technical Analysis Institute, 2026).
The Dragonfly versus Gravestone distinction separates bullish from bearish reversals entirely. A Gravestone Doji mirrors the Dragonfly but inverts the shadow position, the high, open, and close converge at the top of the range while a long upper wick represents rejection of higher prices by sellers. Convergence patterns emerge when a Dragonfly and Gravestone Doji appear in sequence, forming a “Dual Reversal” signal that identifies exhaustion on both sides of the market (MyFunded Capital, 2026).
Mastering reversal candlestick patterns provides the detailed framework for identifying each pattern’s nuances and combining them into robust trading strategies.
Turn Knowledge into Profit
You have done the reading, now it is time to act. The best way to learn is by doing. Open a free, no-risk demo account and practice your strategy with virtual funds today.
Open a Free Demo Account2026 Dragonfly Doji Success Benchmarks (EAV Table)
Dragonfly Doji benchmarks reveal the statistical probability of success based on different confirmation filters used in 2026 technical analysis. The data demonstrates that standalone patterns without filters deliver less than 48% accuracy, while patterns confirmed by moving average filters and RSI context achieve 77% win rates. The best timeframe for Dragonfly patterns remains the Daily chart where institutional accumulation is clearly visible (Quantified Strategies, 2026).
| Entity | Strategy Filter | Win Rate (2026) | Avg Return |
| Dragonfly Doji | 10-Day MA Filter | 77.0% | 0.70% (Source: Quantified Strategies) |
| Dragonfly Doji | RSI < 30 (Oversold) | 72.0% | 0.85% (Source: Strike) |
| Dragonfly Doji | No Filter (Pure) | 47.7% | -0.15% (Source: Research) |
| Dragonfly Doji | Next Candle Confirmation | 65.0%+ | 1.10% (Source: Strike) |
| Dragonfly Doji | High Volume Spike | 68.0% | 1.45% (Source: MyFunded Capital) |
Sources: Quantified Strategies, Strike, MyFunded Capital, Technical Analysis Institute, 2026
Key Takeaways
- The Dragonfly Doji is a bullish reversal pattern where open, high, and close prices converge at the top of the candle.
- Statistics from 2026 show an optimized win rate of 77% when the pattern appears at support with moving average filters.
- A long lower shadow indicates a massive rejection of lower prices by buyers, signaling a potential trend change.
- Confirmation, a close above the Doji’s high, is mandatory to avoid trading “one-day flukes” or noise.
- Daily and Weekly timeframes offer the most reliable signals for this pattern compared to high-frequency intraday charts.
- Combining the Doji with oversold RSI levels (<30) significantly increases the probability of a successful reversal move.
Frequently Asked Questions
This article contains references to Dragonfly Doji Candlestick patterns and Volity, a regulated CFD trading platform. This content is produced for educational purposes only and does not constitute financial advice or a recommendation to buy or sell any financial instrument. Always verify current regulatory status and platform details before using any trading service. Some links in this article may be affiliate links.
[/coi_disclosure]
What Alexander Bennett watches: Single candles are vocabulary, not strategy. The Volity desk grades a dragonfly doji on three axes: location (is it printing at a meaningful structural level), volume (does the wick form on heavier-than-average flow), and confirmation (does the next bar close above the doji body). All three present, the trade is high-conviction. Two of three, the trade is opportunistic. One of three, the candle is noise dressed as signal. Trading every doji that prints is the surest path to a flat equity curve.
Volity desk Q&A
What does a dragonfly doji indicate in a downtrend?
At the end of a defined downtrend, a dragonfly doji signals that sellers attempted to extend the move but failed, with buyers absorbing supply and recovering the open by the period close. The longer the lower wick relative to the prior range, the more meaningful the rejection. Confirmation comes from the next-bar close above the doji body and an expansion in upside volume. The Investopedia dragonfly doji explainer documents the canonical anatomy.
How do I trade a dragonfly doji on a daily chart?
The disciplined approach is a confirmation entry: long on the close above the doji body, stop below the lower wick, target measured by the prior swing range. Position size from the stop distance, not from chart-target enthusiasm. Avoid pre-empting the confirmation candle; many doji formations resolve as continuation rather than reversal, and the false-signal cost compounds quickly without the confirmation filter.
What is the difference between a dragonfly doji and a hammer?
A dragonfly doji has open, high, and close at virtually the same price with a long lower wick, producing a near-flat top. A hammer has a small body near the top of the range with a long lower wick. The dragonfly doji signals greater intra-period indecision because the open and close align almost perfectly; the hammer signals a more directional rejection. Both function as reversal candidates, but the dragonfly typically requires stronger confirmation. The Investopedia hammer pattern reference explains the comparison.
How reliable is the dragonfly doji as a reversal signal?
Reliability is context-dependent. Backtests across major equity indices and major FX pairs typically show modest edge above random when the candle prints at meaningful support with above-average volume. The same candle in mid-range or against the prevailing trend has near-zero historical edge. The signal is not the candle alone; it is the candle plus location plus volume plus confirmation. Skipping any of those filters explains most of the edge that retail traders fail to capture.
External references
Volity operates a trading platform and also publishes educational and analytical content about trading. The content on this page is for educational purposes only and should not be considered financial advice. Volity may benefit commercially when readers open trading accounts through links on this site.
Our content is produced and reviewed under documented editorial standards; comparison and review methodology is published here.