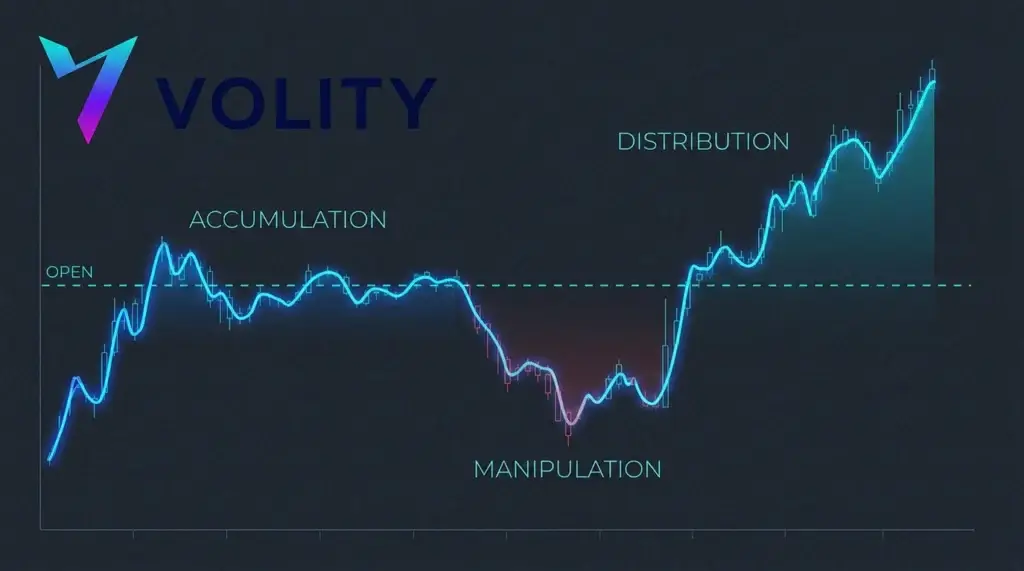
The ICT Power of 3 (PO3) is the idea that every candle forms in three stages: accumulation near the open, manipulation that spikes one way to grab liquidity, and distribution that expands in the true direction and closes near the opposite extreme. It models how the daily candle is built.
What is the ICT Power of 3?
The ICT Power of 3, taught by the Inner Circle Trader, takes the accumulation, manipulation, distribution sequence, an idea rooted in the classic Wyckoff phases of accumulation and distribution, and applies it to a single price bar, usually the daily candle. The claim is simple but useful: a finished candle is built in three stages rather than one clean push. It opens and hovers while positions build, then fakes a move to one side to take liquidity, before expanding in the real direction to close near the far end of its range.
Once you see a candle this way, the daily open becomes a reference point rather than just a number. Where price sits relative to the open, and which side it spiked before expanding, tells a story about the day’s intent. PO3 is one of the most practical smart money concepts tools because it turns an abstract candle into a plan, which is why it earns a place among the best forex trading strategies.
What are the three stages of Power of 3?
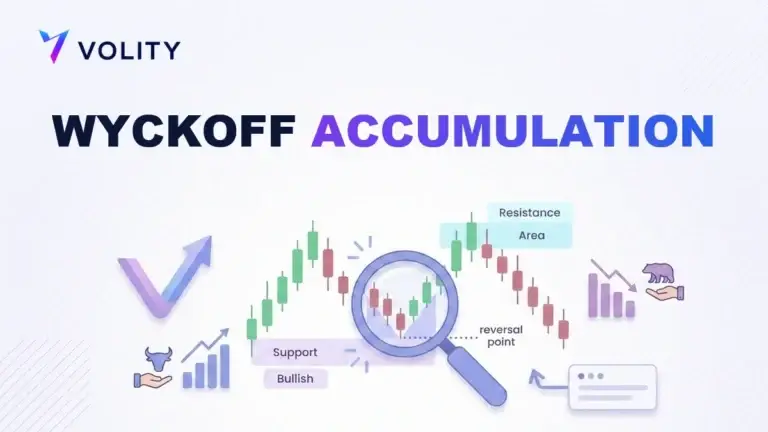
The three stages borrow their names from accumulation and distribution, the phases in the Wyckoff method where positions are quietly built and then unloaded. On a Power of 3 candle they run in order, from the open to the close.
| Stage | What happens | On the candle |
| Accumulation | Price consolidates near the open while positions build | Tight movement around the opening price |
| Manipulation | A spike against the true direction grabs liquidity | A wick beyond the open, often the day’s high or low |
| Distribution | Price expands in the real direction and runs | The body extends and closes near the opposite extreme |
In a bullish Power of 3 day, price opens, dips below the open to grab sell-side liquidity in the manipulation stage, then expands upward and closes near the high. A bearish day is the mirror: open, spike above to take buy-side liquidity, then expand down and close near the low. The manipulation spike is the piece that traps traders, and it has its own name at the session level, the Judas swing.
How is Power of 3 different from AMD?
They describe the same three phases at different scales. The broader accumulation, manipulation, distribution model, often shortened to AMD, can play out over many candles or a whole session. The Power of 3 compresses that sequence into one candle, most often the daily bar, and anchors it to the open and close. Think of AMD as the concept and PO3 as the concept applied to a single bar, which is why they are usually learned together.
How do you read the daily candle with Power of 3?
- Mark the daily open. It is the anchor for everything that follows.
- Watch for accumulation, a period of tight movement around the open early in the day.
- Identify the manipulation spike, a push beyond the open that reaches for liquidity and then stalls.
- Wait for the failure of that spike and a shift back through the open, which signals distribution.
- Expect the expansion to run in the opposite direction to the manipulation and to close near the far extreme.
How do you trade the ICT Power of 3?
- Form a directional bias for the day from higher-timeframe structure and where price sits relative to key levels.
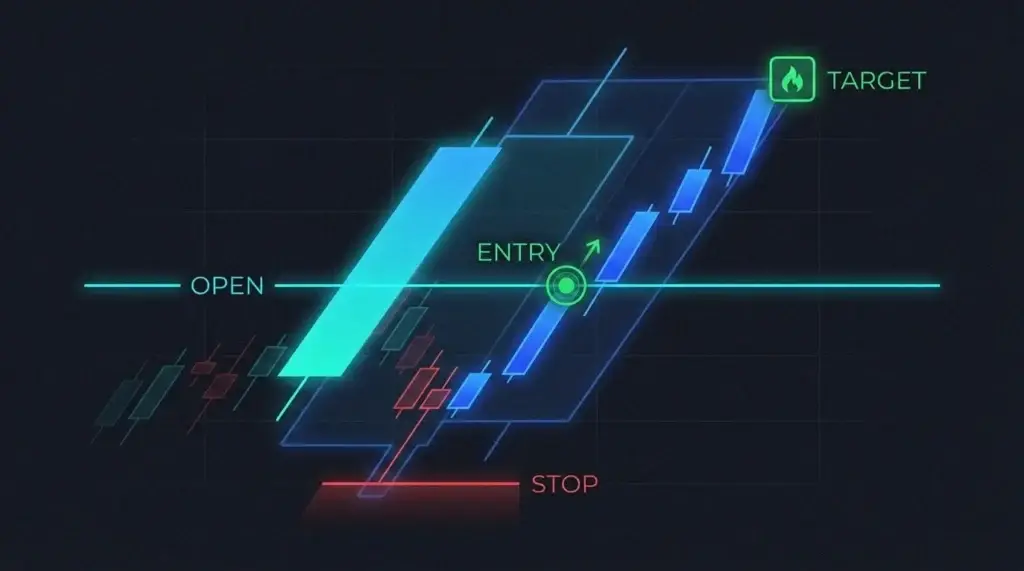
- Wait for the manipulation stage, the spike against your bias that grabs liquidity, rather than entering at the open.
- Look for the spike to fail and price to reclaim the open, which points to distribution in your favour.
- Enter as expansion begins, with the stop beyond the manipulation extreme.
- Target liquidity on the opposite side of the range, in the direction of the expected close.
The manipulation stage is where the Judas swing lives, so trading PO3 well is largely about resisting that spike and waiting for it to fail. The reward is a tight stop beyond the day’s extreme and a target set by the expected close.
What makes a Power of 3 setup high quality?
- A clear higher-timeframe bias, so you are using the manipulation to enter a direction you already expect rather than guessing one.
- A clean liquidity grab, where the manipulation visibly takes an obvious pool before it fails.
- A reclaim of the open, which is a strong tell that distribution is starting once price pushes back through the daily open.
- A defined target, with obvious liquidity in the direction of the expected close to give the expansion somewhere to run.
What are the common Power of 3 mistakes?
- Entering at the open, when the accumulation stage is directionless and the manipulation spike is well placed to stop you out.
- Chasing the manipulation, which is the trap dressed up as the move, so buying or selling into the spike is the classic error.
- Trading with no higher-timeframe bias, which leaves you unable to tell manipulation from genuine expansion.
- Forcing PO3 onto every candle, when plenty of days never form a clean shape and there is simply no setup.
How do you combine Power of 3 with a higher-timeframe bias?
Power of 3 works best as a timing tool inside a direction you already expect. Without a bias, the manipulation spike and the real expansion look the same in the moment, and you end up guessing. The higher timeframe supplies the direction; the daily Power of 3 supplies the entry.
- Set the bias from the weekly or higher-timeframe daily structure. Decide whether price is more likely to expand up or down over the coming days.
- Mark the draw on liquidity. Identify the obvious pool the higher timeframe is likely reaching for, which gives the expansion a destination.
- Wait for the daily manipulation against your bias. In a bullish week, expect the daily candle to dip below its open first, grabbing sell-side liquidity.
- Enter as distribution begins, when price reclaims the open and expands in the direction of your bias, with the stop beyond the manipulation extreme.
The higher-timeframe bias is what tells you the early spike is manipulation rather than the real move. A dip below the daily open in a bullish week is often a buying opportunity, because the bigger picture still points up. Without that context every manipulation looks like a reversal and you get shaken out; with it, the same spike becomes your entry. This is why traders pair the daily Power of 3 with a weekly view, the same multi-day habit that underpins swing trading, rather than trading the candle in isolation.
Putting the ICT Power of 3 to work on Volity
Power of 3 is a daily-cycle model, so it rewards watching the daily open and how each trading session flows on markets you can trade around the clock. Volity offers CFD trading across forex, indices, commodities, and crypto from one account, so you can apply PO3 to the daily candle on any of them. The charts on the Volity platform let you mark the daily open and the manipulation extreme for a precise stop, and leverage of up to 1:500 on forex lets you size to that stop rather than your balance. Leverage cuts both ways, which is why the FCA and ESMA restrict how CFDs are sold to retail traders, so keep the risk on each trade small. Confirm your instrument’s spread and swap on the charges and fees page, and rehearse the read on a free demo before trading it live.
ICT Power of 3 FAQ
What does Power of 3 mean in trading?
Power of 3 means that a candle forms in three stages: accumulation, manipulation, and distribution. Price accumulates near the open, spikes one way to manipulate liquidity, then distributes in the true direction and closes near the opposite extreme. It is an Inner Circle Trader model, most often applied to the daily candle to plan entries around the open.
Is Power of 3 the same as AMD?
They are the same three phases at different scales. AMD, accumulation, manipulation, distribution, is the general model and can span many candles or a session. Power of 3 compresses that sequence into a single candle, usually the daily bar, anchored to the open and close. PO3 is AMD applied to one price bar, which is why the two are taught side by side.
Which candle does Power of 3 apply to?
Most often the daily candle, because the daily open is a widely watched reference and the day gives the sequence room to unfold. The model also applies to weekly candles for a bigger-picture view and to session-based bars for intraday trading. The principle stays the same at every scale: accumulate, manipulate, then distribute toward the close.
How do I use the daily open with Power of 3?
Treat the daily open as the anchor. Price consolidating around it is accumulation, a spike beyond it that fails is manipulation, and a reclaim of the open followed by expansion is distribution. Watching whether price is above or below the open, and which side it spiked first, gives a practical read on the day’s likely direction and where to place a stop.