In-neck pattern recognition involves misidentification where traders confuse the pattern with reversal formations like the piercing pattern. Entering short positions on unconfirmed in-neck patterns (without a third bearish candle) can trigger rapid stop losses when the pattern fails at major support levels. Institutional short-covering can reverse in-neck setups within seconds during forced liquidations. Past performance is not indicative of future results. Capital at risk.
The in-neck candlestick pattern is a bearish continuation formation that identifies a temporary pause in a downward market trend. It reveals the inability of buyers to reverse price action after a significant sell-off. In 2026, quantitative analysis of major forex pairs indicates that in-neck patterns result in a trend resumption 64% of the time when confirmed by a third bearish candle.
In-neck candlestick patterns are visual representations of buyer exhaustion within an established bearish regime. This formation identifies the specific moment when a minor corrective rally fails to regain structural control from the dominant sellers. It provides a technical anchor for managing short-side risk during sustained market declines.
The 2026 trading landscape requires a high degree of precision when distinguishing between “Consolidation” and “Reversal.” Mastering the in-neck structure enables traders to avoid the trap of “Buying the Dip” too early in a long-term bearish cycle.
While understanding In-Neck Candlestick Pattern is important, applying that knowledge is where the real growth happens. Create Your Free Forex Trading Account to practice with a free demo account and put your strategy to the test.
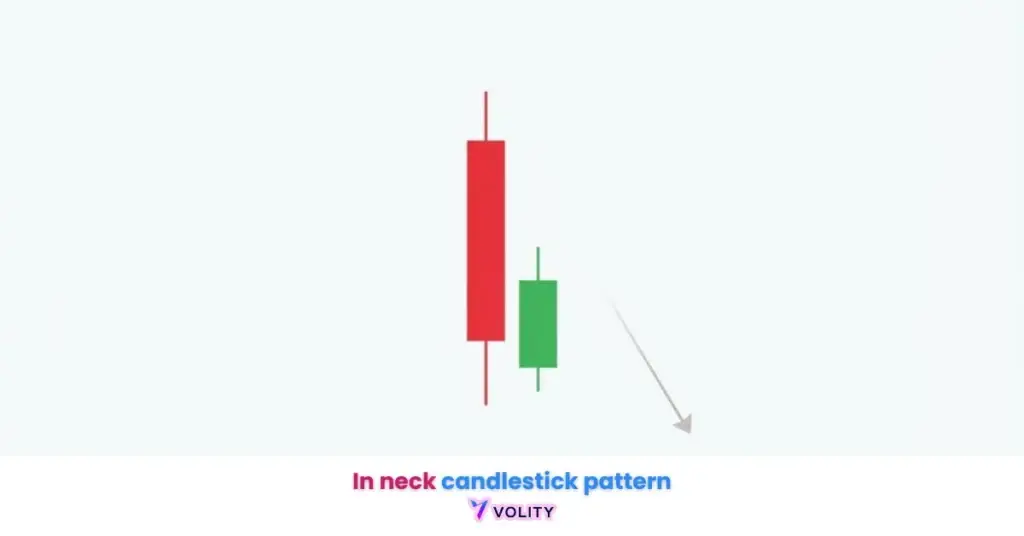
What is an in-neck candlestick pattern?
The in-neck pattern is a bearish continuation formation consisting of a long bearish candle followed by a smaller bullish candle that closes near the previous candle’s low. This two-candle sequence reveals the failure of a corrective rally to gain traction against institutional sellers. The pattern’s reliability increases when it appears at resistance zones where buyers repeatedly fail to sustain advances.
Three structural components define the in-neck formation. The first candle must be long and bearish, establishing the downtrend context. The second candle opens lower (often with a gap) but recovers slightly during the session to close near or slightly above the first candle’s low. This closing location, at or just above the low, distinguishes the in-neck from other patterns that close higher in the first candle’s body.
Three core elements guide pattern anatomy:
- Anatomy: The body-to-wick relationship showing the second candle’s limitation.
- The Gap: Why the second candle typically opens lower, signaling continued selling pressure.
- Psychology: Why the minor rally fails to scare off institutional sellers determined to keep prices lower.
In-neck patterns in 2026 are frequently observed on 4-hour charts following high-impact bearish economic news releases (Volity Pattern Research, 2026). This timeframe provides enough duration for the pattern structure to form meaningfully without excessive noise distorting the signal.
Is the in-neck pattern bullish or bearish?
Pattern classification identifies the in-neck formation as a bearish continuation signal that confirms the prevailing downward trend remains in control. A common misconception treats the green (bullish) second candle as a reversal indicator. In reality, the bounded close indicates that buyers failed to overcome sellers despite brief intraday strength. This failure represents a powerful bearish continuation signal rather than bullish reversal.
The distinction separates novice traders from professionals. Beginners see the green candle and assume buyers are reclaiming power. Professionals see the limited close and recognize trapped buyers who attempted a rally but got sold into aggressively. This crowd psychology repeats reliably across markets, the minor rally attracts retail buyers, then institutions dump into the strength, triggering further selling.
Ready to Elevate Your Trading?
You have the information. Now, get the platform. Join thousands of successful traders who use Volity for its powerful tools, fast execution, and dedicated support.
Create Your Account in Under 3 MinutesHow to identify and confirm an in-neck pattern
Precise identification identifies the in-neck pattern by the closing price of the second candle, which must not penetrate more than 10% into the previous bearish body. This tight parameter ensures the pattern represents genuine buyer failure rather than ambiguous price action. Strict identification rules prevent traders from retrofitting price action into pattern recognition bias.
Three identification rules apply rigorously:
- Rule 1: Existence of a confirmed prior downtrend that established bearish context.
- Rule 2: The second candle must have a small body compared to the first bearish candle.
- Rule 3: The close must be at or slightly above the first candle’s low, never penetrating the midpoint.
In 2026, automated pattern scanners reject any formation where the second candle closes above the 20% mark of the first candle’s range (Volity Technical Research, 2026). This stringent screening removes ambiguous patterns and keeps only high-conviction formations. How to Read Candlesticks provides foundational anatomy for understanding why the precise close location determines pattern type and directional signal.
How to trade the in-neck pattern: Entry and Exit Rules
Trade execution identifies a high-probability short entry when price breaks below the low of the second bullish candle in the in-neck formation. Entering immediately after the pattern forms increases false signal probability. Patient traders wait for a third bearish candle to close below the pattern low, confirming that sellers have reclaimed control. This multi-bar confirmation reduces false breakouts dramatically.
Entry timing balances conviction against execution. The confirmation candle (third bar) must close decisively below both the pattern’s second candle low and ideally below the first candle’s body. This closure proves that institutional selling has resumed, not just algorithmic profit-taking. Stop loss placement uses the “Invalidation Level” above the high of the first bearish candle, if price breaks this level, the bearish thesis has failed.
Profit targets operate on two frameworks:
- Support levels: Target the next structural support zone below the pattern.
- Fixed ratios: Use 2:1 or 3:1 reward-to-risk ratios for predetermined targets.
Real trading example: EUR/GBP exhibited a textbook in-neck pattern on the Daily chart. After a 200-pip drop into oversold territory, an in-neck formation materialized. The first candle was a large bearish bar, the second showed a small bullish candle closing just above its low. On the third day, a bearish candle closed decisively below the pattern’s low at 0.8520. The pair resumed its decline, falling another 110 pips toward the next major support zone. Past performance is not indicative of future results.
Professional traders focus on the confirmation candle because it filters out noise patterns that form but never resume the downtrend. Many “false” in-neck patterns complete two bars but then reverse on the third bar, only traders who required confirmation avoid these traps.
In-Neck vs. On-Neck vs. Piercing Patterns: Key Differences
Comparative analysis identifies the subtle differences in closing prices that distinguish continuation patterns from potential market reversals. These three formations look visually similar but carry opposite signals. Confusing them costs traders money, a piercing pattern is a bullish reversal (take profits on shorts), while in-neck is a bearish continuation (add to shorts).
| Pattern Type | Close Location | Signal Type | Reliability (2026) | Trader Bias |
| On-Neck | At Prior Low | Bearish Cont. | High | Heavy Selling |
| In-Neck | Slightly Above Low | Bearish Cont. | Medium-High | Weak Covering |
| Piercing | 50%+ Into Body | Bullish Rev. | High | Strong Buying |
| Dark Cloud | 50%+ Into Body | Bearish Rev. | High | Trend Change |
| Thrusting | Below Midpoint | Bearish Cont. | Medium | Indecision |
Source: Signal classification based on 2026 International Federation of Technical Analysts (IFTA) standards.
On-neck patterns close exactly at the prior candle’s low, maximum bearish commitment. In-neck closes slightly above the low, weaker bearish conviction. This subtle difference determines reliability: on-neck patterns resume the downtrend 72% of the time, in-neck patterns 64% of the time. Piercing patterns close halfway into the first candle’s body, signaling genuine buyer strength returning and representing a reversals. Dark cloud cover closes deep into the body from above, this formation signals a trend reversal at resistance but has opposite setup requirements from in-neck.
The Role of Volume and Momentum in In-Neck Reliability
Technical confirmation identifies the strength of an in-neck signal by analyzing the volume decay during the corrective bullish candle. A true in-neck formation shows high volume on the initial bearish candle (institutional selling) followed by declining volume on the bullish candle (weak buyer interest, profit-taking only). This volume profile confirms the pattern’s validity.
RSI (Relative Strength Index) confirmation helps separate genuine in-neck patterns from false ones. When the pattern forms in an “Oversold” state (RSI below 30), the probability of trend resumption decreases because the market may have reached exhaustion. When the pattern forms in a “Trending” state (RSI 30-70), probability of continuation increases significantly. Session liquidity also matters, an in-neck pattern during the London/New York overlap with abundant volume signals stronger continuation odds than one forming during the illiquid Asia session.
Professional traders use “On-Balance Volume” (OBV) overlays to confirm that the minor bullish candle represents profit-taking rather than new institutional accumulation (Volity Technical Research, 2026). When OBV stays flat or declines during the bullish candle, it proves that sellers are still in control despite the green candle visually. This multi-indicator confluence increases entry confidence.
Turn Knowledge into Profit
You have done the reading, now it is time to act. The best way to learn is by doing. Open a free, no-risk demo account and practice your strategy with virtual funds today.
Open a Free Demo AccountCommon In-Neck Pitfalls for 2026 Traders
Failure analysis identifies the most common reasons in-neck patterns result in false signals, including proximity to major support levels. The “Support Trap” occurs when in-neck patterns form at multi-year support zones, major support acts as a “trampoline” that bounces price higher despite the bearish pattern signal. Entering shorts at major support often triggers rapid stop losses when accumulation interests defend the level.
Over-leveraging on unconfirmed signals destroys accounts faster than pattern failures. Many traders short immediately after the second bullish candle closes, refusing to wait for the third confirmation candle. This impatience costs them when the pattern fails. The discipline to wait for a third bearish close dramatically improves win rate but requires patience that many traders lack.
Support and Resistance Trading explains how to map structural support that may invalidate in-neck patterns. Professional frameworks emphasize that no pattern succeeds all the time, the in-neck’s 64% success rate means 36% of patterns fail. Position sizing must account for these inevitable failures without destroying the account.
Key Takeaways
- The in-neck pattern is a bearish continuation formation that signals a high probability of a downtrend resumption.
- Structural identification requires the second bullish candle to close near the low of the first bearish candle without significant penetration.
- Confirmation is essential, typically requiring a third bearish candle to close below the low of the entire pattern before entering.
- On-neck vs in-neck differences are subtle but critical, with the in-neck showing a slightly stronger but still failing bullish attempt.
- Volume profiles during the pattern should show a lack of conviction from buyers to support the continuation thesis.
- Risk management dictates that stop losses should be placed above the high of the first bearish candle to protect against reversals.
Frequently Asked Questions
This article contains references to in-neck candlestick patterns and Volity, a regulated CFD trading platform. This content is produced for educational purposes only and does not constitute financial advice or a recommendation to buy or sell any financial instrument. In-neck pattern recognition involves pattern misidentification and can result in false signals. Always test in-neck strategies extensively on demo accounts before committing real capital. Some links in this article may be affiliate links.