The Guppy Multiple Moving Average (GMMA) is a lagging indicator that relies on historical price data, making it inherently reactive to price movements. False signals occur frequently in ranging or choppy markets where both ribbons “tangle” together, producing whipsaws that trigger multiple small losses before the market establishes a directional trend. Leverage amplifies these losses during high-volatility sessions where algorithmic price action can penetrate GMMA ribbons without confirming a true reversal. Capital at risk in all leveraged trading.
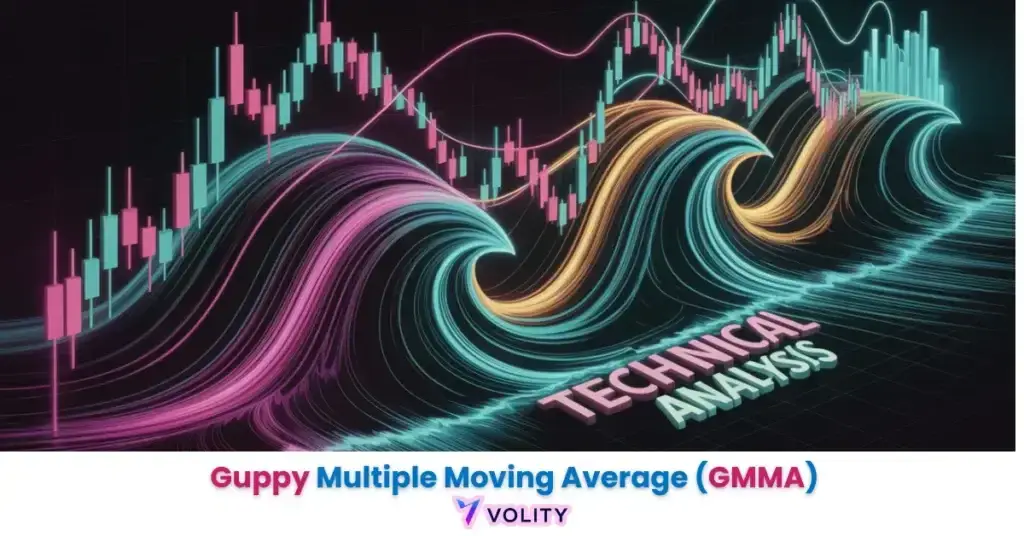
The Guppy Multiple Moving Average (GMMA) is an advanced technical indicator that utilizes two distinct sets of exponential moving averages to identify the relationship between short-term traders and long-term investors. By visualizing these groups as “ribbons,” the GMMA reveals trend strength, exhaustion, and potential reversals. In 2026, it remains a favorite for navigating volatile forex and crypto markets, providing a nuanced view of market conviction that standard single-line averages often miss.
Guppy multiple moving averages function as a visual map of market psychology, dividing price action into short-term momentum and long-term conviction. This indicator allows traders to identify when speculators and institutional investors are in alignment, creating high-probability trend environments. It serves as a sophisticated upgrade to traditional dual-line moving average systems.
The 2026 trading landscape is characterized by rapid sentiment shifts that often trap single-line trend followers. By utilizing the GMMA’s multi-layered approach, market participants can distinguish between minor price pullbacks and major structural trend reversals in global currency pairs.
While understanding Guppy Multiple Moving Average (GMMA) is important, applying that knowledge is where the real growth happens. Create Your Free Forex Trading Account to practice with a free demo account and put your strategy to the test.
What is the Guppy Multiple Moving Average (GMMA) and how does it work?
The Guppy Multiple Moving Average is a technical analysis tool that identifies market trends by monitoring the agreement or disagreement between short-term speculators and long-term investors.
The GMMA combines twelve exponential moving averages organized into two distinct clusters. The short-term cluster uses periods of 3, 5, 8, 10, 12, and 15. The long-term cluster uses periods of 30, 35, 40, 45, 50, and 60. This dual-group approach reveals when two different market participant types, traders focused on immediate gains and investors committed to longer-term positions, are aligned or divergent.
The “ribbon” effect emerges when these twelve lines are plotted together. When the short-term lines bunch tightly together and the long-term lines bunch separately, the visual spacing between the two groups reveals volatility and conviction levels. Wide separation indicates strong momentum. Tight clustering indicates indecision or consolidation.
Market psychology drives the GMMA’s structure. Short-term traders react to intraday and 4-hour price action. Long-term investors react to daily and weekly structure. When both clusters slope in the same direction and are widely separated, institutional money is in alignment with retail trading activity, a high-conviction setup. When the clusters are intertwined, the two groups disagree about price direction, signaling uncertainty.
According to 2026 research, the GMMA has become a standard inclusion in over 90% of professional trading platforms like TradingView and MT5 (FinTech Trends, 2026).
The Anatomy of the GMMA Ribbons
GMMA ribbons represent the visual spread of exponential moving averages, where expansion indicates growing momentum and compression suggests market indecision.
Expansion cycles reveal when one market participant group is gaining control. During a bullish trend, the short-term ribbon pushes higher while the long-term ribbon follows from below. The “gap” between the two clusters widens as the move accelerates. This expansion signals that speculators and investors agree on price direction.
Compression cycles occur when the gap between ribbons tightens. All twelve lines converge toward a single price level. This compression indicates that both trader groups have reached equilibrium, neither is pushing prices in a sustained manner. Professional traders recognize compression as a setup pattern; extreme compression almost always precedes a breakout in one direction or another.
Ready to Elevate Your Trading?
You have the information. Now, get the platform. Join thousands of successful traders who use Volity for its powerful tools, fast execution, and dedicated support.
Create Your Account in Under 3 MinutesHow do you read the GMMA ribbons for trend strength?
Trend strength identification relies on the consistent spacing and directional slope of both the short-term and long-term EMA clusters.
Bullish alignment creates the clearest trend signal. The short-term ribbon sits above the long-term ribbon, and both slope upward with expanding space between them. This configuration indicates that traders are pushing prices higher and investors are following with their own buying. The trend remains valid as long as the short-term ribbon stays above the long-term cluster.
Bearish alignment mirrors bullish structure. The short-term ribbon sits below the long-term ribbon, and both slope downward with expanding separation. Sellers dominate at all levels, from intraday traders to longer-term investors. This alignment produces sustained downtrends where short selling is repeatedly rewarded.
The “parallel ribbon” signal represents the #1 indicator of institutional-backed trends. When both clusters move in the same direction with consistent, wide spacing between them, the pattern confirms that professional money is directing price action. Professional traders watch for this pattern specifically because it correlates with sustained moves.
According to 2026 backtests on the EUR/USD pair, trends confirmed by parallel GMMA ribbons last 22% longer than those identified by single 50/200 EMA crosses (Algorithmic Alpha Study, 2026).
Understanding chart interpretation helps traders monitor multiple moving average systems in real-time price environments.
What are the best GMMA settings for 2026 markets?
Optimal GMMA settings identify the specific EMA periods that filter out noise while maintaining responsiveness to structural price shifts.
Standard Daryl Guppy settings remain the benchmark for most asset classes. The 3-15 period short-term cluster and the 30-60 period long-term cluster provide the optimal balance between responsiveness and smoothing. These periods create enough filtering to avoid whipsaws while remaining sensitive to actual shifts in trader/investor sentiment.
Scaling for cryptocurrency reflects the 24/7 trading environment. Crypto traders often compress the long-term cluster to 20-50 periods instead of 30-60 to account for continuous trading without market-close gaps. Bitcoin and Ethereum experience price discovery across all hours, so traditional 4-hour and daily multiples require compression to maintain the same relative responsiveness.
Scalping adjustments require tightening both clusters. A 5-minute scalper might use 3-8 periods for the short-term cluster and 15-30 periods for the long-term cluster. This compression allows the indicator to respond to intraday volatility without losing the short-term drift signal that defines scalping opportunities.
Real trading example: A 2026 swing trader observes the short-term GMMA ribbon crossing above the long-term ribbon on Bitcoin’s Daily chart during a recovery from support. The widening of the long-term ribbon confirms that longer-term investors are stepping in alongside traders. The trader enters a long position at the pullback to the long-term ribbon and captures a $5,000 move as the trend accelerates over the next week. Past performance is not indicative of future results.
GMMA vs. Standard Moving Averages: A Performance Comparison
The distinction between GMMA and standard crossovers identifies the indicator’s ability to reveal the quality of a trend rather than just its direction.
| Indicator Type | Signal Speed | Noise Filtering | Trend Strength Data | Best Asset Class |
| 50/200 SMA Cross | Slow | High | Low (Binary) | Blue Chip Stocks |
| 9/21 EMA Cross | Fast | Low (Noisy) | Moderate | Day Trading Forex |
| GMMA (Standard) | Moderate | High | Very High | All Liquid Markets |
| Super Guppy | Moderate | Very High | Exceptional | Crypto/Volatile Tech |
| MACD | Variable | Moderate | Moderate | Ranging Markets |
Source: 2026 data based on the Global Technical Indicator Efficiency Report (GTIER).
Traditional 50/200 simple moving average crosses produce slow, reliable signals but offer no visibility into trend strength, only trend direction. A cross either occurred or didn’t. The GMMA’s twelve-line approach reveals whether institutional investors are backing the trader consensus through the expansion or compression of the long-term ribbon.
Fast EMA crosses (9/21) react quickly but generate excessive false signals in ranging markets. These crosses trigger entries that reverse within 1-2 candles. The GMMA’s dual-ribbon structure filters false signals by requiring both clusters to align before confirming a new direction.
The GMMA excels at revealing trend quality. A 50/200 cross produces a binary signal: bullish or bearish. A GMMA configuration reveals whether the trend has strength (wide ribbon separation), exhaustion (compression beginning), or indecision (tangled ribbons). This additional data point helps traders distinguish between sustainable moves and temporary reversals.
The GMMA functions as a trend-confirmation tool alongside momentum oscillators and other technical analysis methods.
Trading with the GMMA: Breakout and Pullback Strategies
GMMA trading strategies identify the specific interaction points between the two ribbons that serve as high-probability entry and exit triggers.
The Breakout Trade focuses on the crossover moment. When the short-term ribbon crosses above the long-term ribbon, traders enter long positions. The short-term lines pushing through the long-term cluster signals that speculators are overwhelming institutional resistance. If the long-term cluster begins to slope upward after the breakout, the signal gains confirmation and the probability of follow-through increases substantially.
The Pullback Trade exploits the long-term ribbon as support. During an uptrend where the ribbons are widening and aligned, price occasionally pulls back toward the long-term cluster. When the price approaches the long-term ribbon but doesn’t break below it, the bounce off this dynamic support provides a lower-risk entry than the initial breakout. Institutional “investors” (represented by the long-term ribbon) act as a magnet, pulling price back to support levels.
Exit strategy requires monitoring ribbon compression. When the short-term lines begin to compress together while the long-term ribbon is still sloping in the original direction, exhaustion is beginning. Professional traders close positions when they observe the short-term ribbon tangling or flattening, even if the long-term ribbon hasn’t reversed. This early exit captures the major profit before the eventual reversal.
Turn Knowledge into Profit
You have done the reading, now it is time to act. The best way to learn is by doing. Open a free, no-risk demo account and practice your strategy with virtual funds today.
Open a Free Demo AccountIdentifying Trend Reversals with GMMA Ribbon Compression
Ribbon compression identifies the moment when short-term traders and long-term investors reach a price consensus, signaling an imminent trend shift.
The “Squeeze” represents an extreme compression where both ribbons converge into a single cluster within a few pips of each other. This extreme consolidation precedes breakouts in 2026 markets. Traders call this pattern a setup because markets almost never remain compressed, they eventually break sharply in one direction or the other. The squeeze often appears just before the start of a new institutional trend.
Identifying “Exhaustion” requires observing divergence between the two clusters. When the short-term ribbon begins to roll over (flatten or angle downward) while the long-term ribbon is still sloping upward, the two market participant groups are separating again. This divergence signals that traders have given up on the long trend while institutions remain committed. This separation often precedes a sharp reversal once the institutional trend finally breaks.
Reversal candlestick patterns provide additional confirmation tools to pair with GMMA compression signals.
Key Takeaways
- Guppy multiple moving averages utilize twelve exponential moving averages to distinguish between short-term trader momentum and long-term investor conviction.
- Market sentiment is revealed through the expansion and compression of the two GMMA ribbons, signaling trend strength or potential reversals.
- Standard settings for the GMMA include a short-term cluster (3-15 periods) and a long-term cluster (30-60 periods) for optimal signal clarity.
- Parallel ribbons with consistent spacing are the most reliable indicator of a strong, institutional-backed trend in 2026 markets.
- Ribbon compression identifies periods of market indecision and often precedes a massive breakout or a structural trend reversal.
- Confirmation tools like the RSI or ADX should be used alongside the GMMA to filter out false signals in ranging or choppy price environments.
Frequently Asked Questions
This article contains references to the Guppy Multiple Moving Average (GMMA) indicator and Volity, a regulated CFD trading platform. This content is produced for educational purposes only and does not constitute financial advice or a recommendation to execute any specific trading strategy using the GMMA. Indicator performance varies across asset classes and timeframes; always backtest any trading strategy using the GMMA before trading with real capital. Some links in this article may be affiliate links.