Single candlestick patterns appear frequently but generate false signals when missing volume confirmation or structural alignment. Patterns forming in open chart space carry negligible probability compared to those at resistance or support zones. Relying on isolated candles without additional confirmation creates whipsaw losses. Algorithmic targeting of obvious patterns often triggers liquidity grabs that trap retail traders. Past performance is not indicative of future results. Capital at risk.
Single candlestick patterns are one-bar price-action formations that identify shifts in buying and selling pressure through the relationship of their open, high, low, and close prices. They are best read as context rather than as signals in their own right: the two with published tested statistics, the Hammer and the Shooting Star, reverse 60% and 59% of the time respectively in Thomas Bulkowski’s testing, which he calls near random. Traders utilize reversal candles like the Hammer and Shooting Star, alongside momentum signals like the Marubozu, to detect institutional turning points and volatility contraction cycles.
Single candlestick patterns function as the granular building blocks of price action, revealing immediate shifts in market sentiment within a single trading period. These formations compress the battle between supply and demand into one candle’s structure, the open, close, upper wick, and lower shadow. They remain essential for identifying high-probability entries in algorithmic markets.
The 2026 trading environment generates frequent single-candle formations, yet most carry minimal edge without volume confirmation and structural context. Traders who combine pattern identification with institutional participation signals capture reversals that solo patterns miss. This guide identifies which single-candle formations deliver consistent edge across major timeframes.
While understanding Forex is important, applying that knowledge is where the real growth happens. Create Your Free Forex Trading Account to practice with a free demo account and put your strategy to the test.
What is a single candlestick pattern and how do I use it in 2026?
A single candlestick pattern is a one-period price formation that identifies the relationship between an asset’s open, high, low, and close prices.
Single candles display four price points: the opening price, the closing price, and the high and low prices reached during that session. The difference between open and close creates the real body (filled or hollow rectangle), while price movement beyond the body creates upper and lower wicks that signal rejection at extreme levels. Single candles distinguish themselves from multi-candle patterns like Engulfing or Harami through their isolated structure, they stand alone rather than requiring confirmation from a preceding or following candle.
Algorithmic execution has not removed single-candle patterns from use, but it has made the level they form at more important than the shape itself. Higher timeframes carry more participation and less noise, which is the usual argument for reading these patterns on the daily rather than the 15-minute chart. No published test isolates the size of that difference.
Ready to Elevate Your Trading?
You have the information. Now, get the platform. Join thousands of successful traders who use Volity for its powerful tools, fast execution, and dedicated support.
Create Your Account in Under 3 MinutesWhich single candlestick pattern is the most reliable for reversals?
The Hammer and Shooting Star are the most reliable single candlestick reversal patterns when identified at structural market boundaries.
The Hammer candlestick forms during downtrends and features a small real body positioned at the upper end of the range, combined with a long lower wick extending at least 2-3 times the body height. This structure signals that sellers attempted to drive price lower during the session, but buyers reclaimed control and closed the candle near the open, creating rejection of lower prices. Bulkowski’s testing has the hammer acting as a bullish reversal 60% of the time, ranking it 26th of 103 candle types for reversal reliability but only 65th for the size of the move that follows, which is why the level it forms at matters more than the candle.
The Shooting Star is the inverse, forming after uptrends with a small body at the lower range and a long upper wick representing rejected buying pressure. Body colour is often said to matter, but no published test isolates it, so treat it as a preference rather than an edge. Both patterns require volume confirmation and structural alignment to deliver sustained reversals rather than temporary bounces.
Always verify the location of a single candlestick pattern against prior weekly demand zones or multi-month resistance; a Hammer printed in open chart space carries significantly less institutional weight than one at a structural horizontal floor.
What is the success rate of the Marubozu candlestick in 2026?
The Marubozu candlestick identifies a state of undisputed directional momentum where the session opens at one extreme and closes at the other with no wicks.
The Marubozu represents a powerful momentum signal because both opening and closing at the extreme suggests one side maintained complete control throughout the entire session. Bullish Marubozu candles indicate strong buying pressure that started aggressively and closed even higher, forecasting trend continuation. Bearish Marubozu candles show sellers maintained control from open to close, often signaling the start of structural declines.
A Marubozu is read as a continuation signal because one side held control for the whole session, and it carries most weight when it closes beyond a level the market has already respected. There is no published tested success rate for it, so size the trade on the level rather than on the candle.
How do I distinguish between a Doji and a Spinning Top?
Indecision candle analysis identifies the specific body-to-wick ratios that distinguish a stalemate Doji from a high-volatility Spinning Top.
| Pattern Type | Body Size | Wick Length | What it reads as | Tested result, where one is published |
| Doji | Near Zero | Medium/Long | Equilibrium | No published tested figure |
| Spinning Top | Small | Balanced | Indecision | No published tested figure |
| Hammer | Small | Long Lower | Bullish reversal | Reversal 60% of the time (Bulkowski); performance rank 65 of 103 |
| Shooting Star | Small | Long Upper | Bearish reversal | Reversal 59% of the time (Bulkowski), which he calls near random |
| Marubozu | Full Size | Zero | Momentum continuation | No published tested figure |
Tested figures from Thomas Bulkowski, thepatternsite.com: hammer and shooting star. Where no tested figure is published, none is claimed.
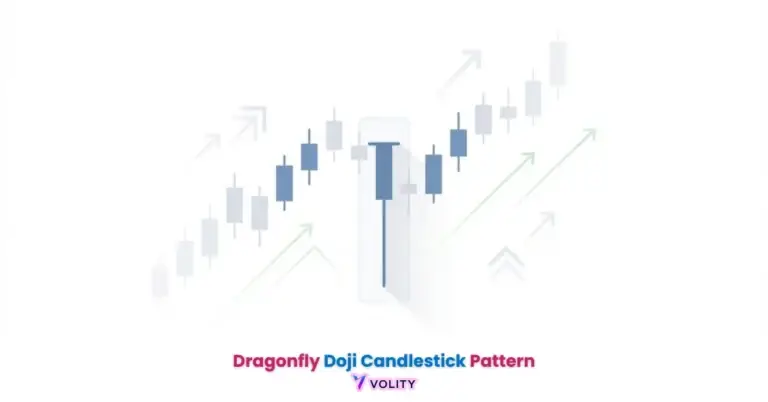
A Doji forms when open and close prices are virtually identical, creating a cross-shaped formation with wicks extending equally in both directions. This pattern signals market indecision, neither buyers nor sellers established control during the session, resulting in a stalemate. The Spinning Top resembles a Doji but retains a small real body, indicating slightly more directional control than a Doji while still showing high volatility indecision.
WARNING: Beware of the ‘Anticipation Trap’ in 2026; entering a trade before the pattern’s session closes, reasoning that the shape is obvious, results in wider stop-loss distances and a higher failure rate than waiting for the confirmed candle closure.
Do single candlestick patterns still have an edge in 2026 markets?
The algorithmic edge of single candlestick patterns identifies a compressed win rate that requires multi-factor confirmation to remain profitable in modern markets.
The raw edge of standalone single-candle patterns has compressed as algorithms target obvious formations for liquidity grabs. Traders entering on Hammer patterns without volume confirmation often face stop-runs targeting the upper wick, creating cascading losses. The path to profitability requires confirmation synergy: combining RSI divergence signals with MACD crossovers to validate pattern strength, and requiring a clear expansion in volume against the recent average.
Volume expansion on the trigger candle against the 20-session average is the most useful available filter for separating genuine rejection from a low-conviction wick that fades on the next bar. Retail traders often lose money by trading indecision patterns like Dojis in isolation; a Doji only carries weight if it forms at a multi-year horizontal level or psychological round number where institutional sell orders cluster.
💡 KEY INSIGHT: Volume expansion on the trigger candle against the 20-session average is the most reliable filter for single-candle edge; it distinguishes a genuine institutional rejection from a low-conviction wick that will likely fade on the next bar.
Turn Knowledge into Profit
You have done the reading, now it is time to act. The best way to learn is by doing. Open a free, no-risk demo account and practice your strategy with virtual funds today.
Open a Free Demo AccountBest Timeframes for Trading Single Candlestick Patterns
Timeframe alignment identifies the structural significance of single-candle patterns, with Daily and 4-hour charts offering the highest signal-to-noise ratio.
The daily timeframe carries the most participation, so a single-candle pattern sitting on a daily support or resistance level is worth more attention than the same shape on a 15-minute chart. Four-hour candles work as a confirmation filter: a daily hammer backed by a four-hour chart showing repeated failed rallies is a better read than the hammer alone. None of these differences has a published tested figure attached to it.
15-minute scalping remains viable but requires tighter profit-taking and mechanical discipline to avoid overcommitting to marginal setups. Professional traders tier timeframes: Daily patterns anchor core position entries, 4-hour charts refine entry timing, and 1-hour candles guide intra-day tactical exits. This multi-timeframe layering increases pattern reliability and reduces false breakout exposure across volatile sessions.
Key Takeaways
- Single candlestick patterns are one-period price formations that provide immediate insights into market sentiment and momentum shifts within a trading session.
- Bulkowski’s tested figures have the Hammer reversing 60% of the time and the Shooting Star 59%, which he describes as near random, so the level the candle forms at does more work than the candle.
- Marubozu candles identify undisputed directional control within a session, and are read as continuation signals; no published test puts a success rate on them.
- Higher timeframes carry more participation and less noise, which is the practical argument for reading these patterns on the daily chart rather than intraday.
- Confirmation through volume expansion and structural alignment is mandatory for separating genuine institutional flow from algorithmic liquidity grabs.
- Indecision signals like the Doji and Spinning Top represent market stalemate and require a confirmed structural break to validate potential reversals.
Frequently Asked Questions
This article contains references to Single Candlestick Patterns, Reversal Formations, and Volity, a regulated CFD trading platform. This content is produced for educational purposes only and does not constitute financial advice or a recommendation to buy or sell any financial instrument. Always verify current regulatory status and platform details before using any trading service. Some links in this article may be affiliate links.