The Awesome Oscillator (AO) is a powerful momentum indicator developed by Bill Williams, designed to visually represent market momentum and signal potential trend changes. It compares short-term and long-term momentum using midpoint prices, helping traders identify bullish or bearish forces. This guide will teach you how to interpret its signals, apply key trading strategies like Zero Line Cross and Twin Peaks, and effectively combine it with other indicators for more reliable trading decisions.
While understanding Awesome Oscillator is important, applying that knowledge is where the real growth happens. Create Your Free Forex Trading Account to practice with a free demo account and put your strategy to the test.
What is the Awesome Oscillator (AO)? Your Essential Guide to Market Momentum
The Awesome Oscillator (AO) is a technical analysis indicator developed by renowned trader Bill Williams that visually represents market momentum over a specific period. It helps traders identify whether bullish or bearish forces are dominating the market, signaling potential trend changes or continuations. This tool is fundamental for analyzing price action effectively.
Bill Williams’ Momentum Tool
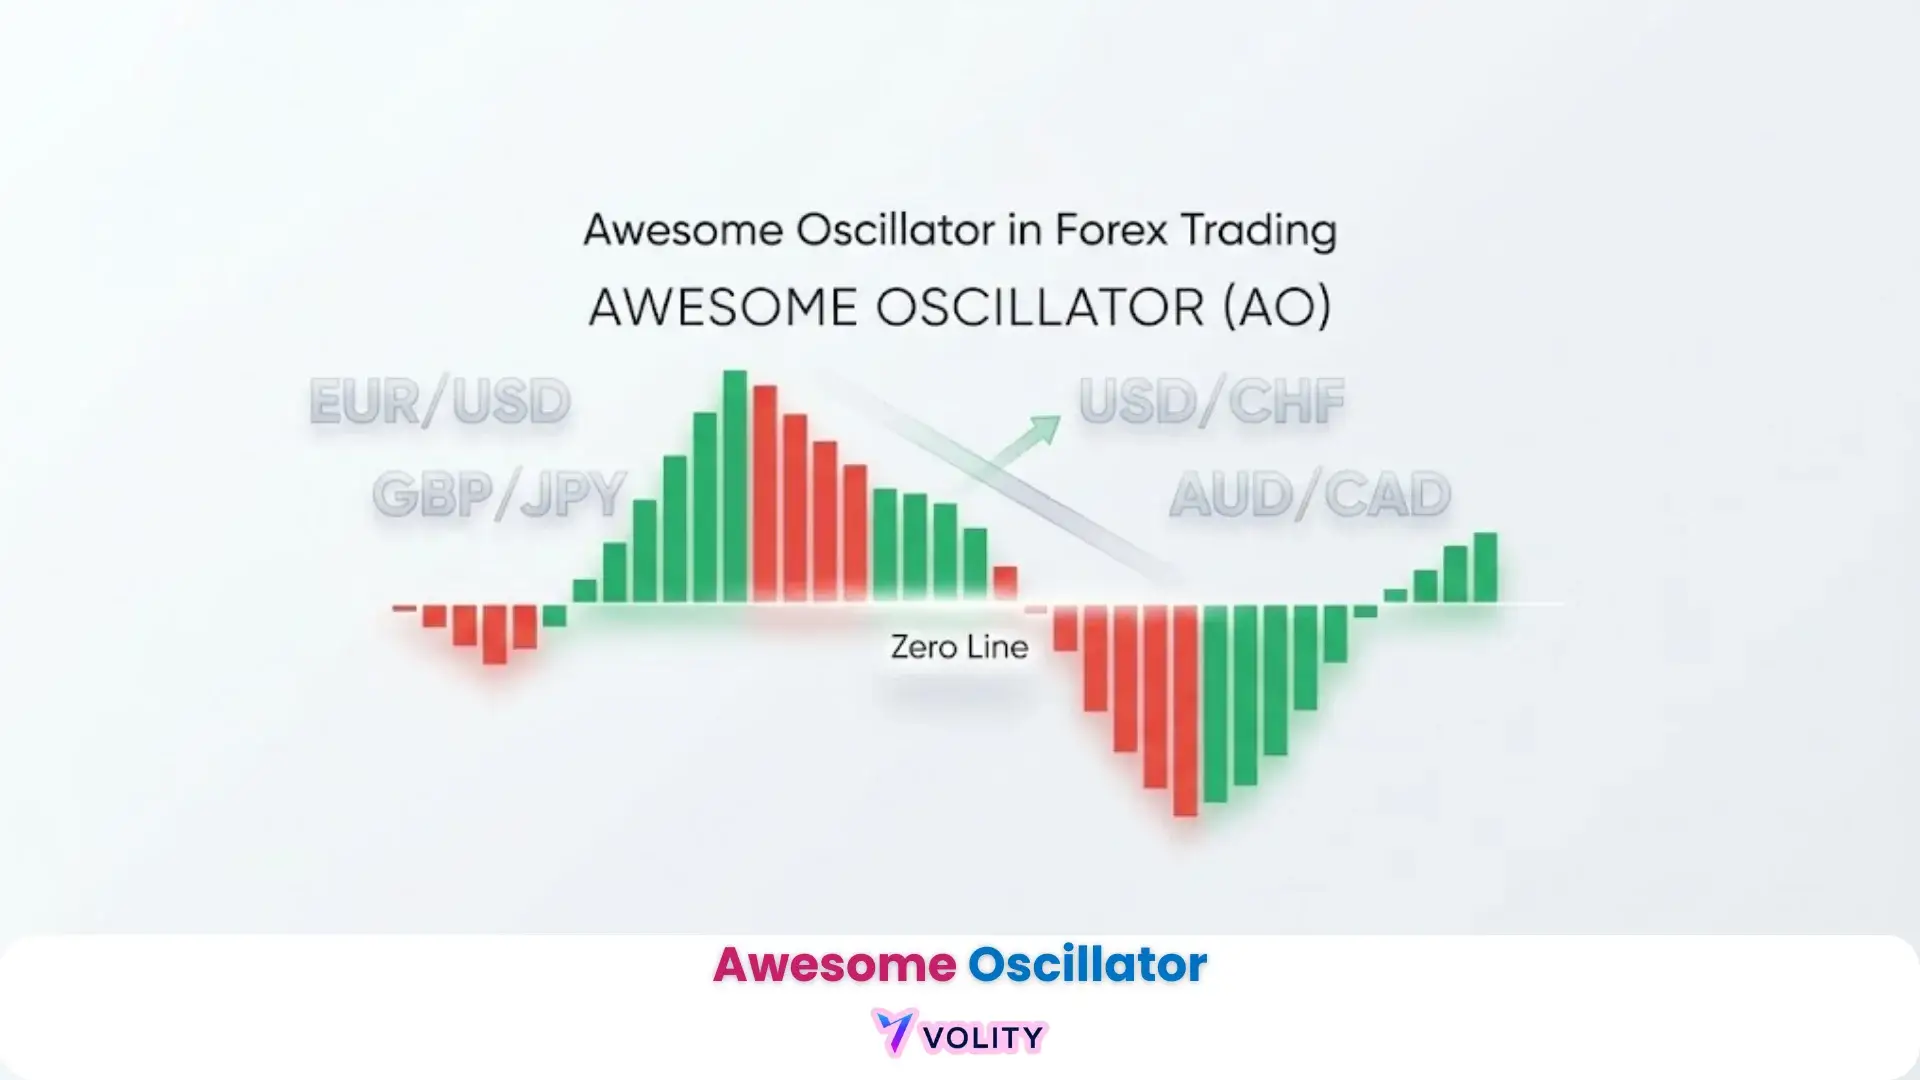
The Awesome Oscillator, developed by renowned trader Bill Williams, is a momentum indicator that shows the market’s momentum over a specific period. This tool is a histogram displayed below the price chart, typically fluctuating above and below a central zero line.
It helps traders visualize the strength and direction of price movement, making it a crucial component of technical analysis.
Bill Williams introduced the AO as part of his “Chaos Theory” approach to trading, emphasizing the psychological aspects of market behavior. Unlike simple moving averages, the AO uses the midpoint of price bars, providing a smoother and more responsive representation of momentum shifts.
It serves as a visual aid to quickly discern whether the immediate momentum is stronger than the broader momentum.
Understanding its Mechanics
The Awesome Oscillator works by comparing recent market momentum to a broader momentum over a longer period. It is represented as a bar chart or histogram, where each bar’s length and color reflect the current momentum. Green bars indicate increasing momentum, while red bars show decreasing momentum.
The zero line is a critical component of the AO, acting as a threshold between bullish and bearish momentum. When the histogram bars are above the zero line, it signals that short-term momentum is stronger than long-term momentum, indicating bullish pressure. Conversely, bars below the zero line suggest bearish pressure.
The interaction of the histogram with the zero line forms the basis for several key trading strategies.
Decoding Awesome Oscillator Signals
Understanding the calculation behind the Awesome Oscillator is crucial for interpreting its signals accurately. This indicator provides insights into market momentum by comparing different periods of price action. Its visual representation, including colors and the zero line, offers immediate cues about market direction and strength.
How is the Awesome Oscillator calculated?
The Awesome Oscillator is calculated as the difference between a 5-period simple moving average (SMA) and a 34-period simple moving average, both calculated using the midpoint of the price bar ((High + Low)/2).
This formula prioritizes the “median price” over the closing price, which helps to smooth out volatility and provide a more accurate representation of the market’s energy. The 5-period SMA represents the short-term momentum, while the 34-period SMA reflects the longer-term momentum.
The calculation process involves these steps: 1. Calculate the Midpoint Price: For each bar, find (High + Low) / 2. 2. Calculate the 5-Period SMA: Average the last five midpoint prices. 3. Calculate the 34-Period SMA: Average the last 34 midpoint prices. 4. Calculate the AO: Subtract the 34-period SMA from the 5-period SMA.
This difference creates the histogram bars, where values above zero indicate that the short-term momentum is accelerating faster than the long-term momentum, suggesting buying pressure. Values below zero show the opposite, indicating selling pressure.
How to interpret Awesome Oscillator signals? What do the colors of the Awesome Oscillator mean? What is the zero line in Awesome Oscillator?
Interpreting Awesome Oscillator signals involves understanding the histogram bars’ colors, their relationship to the zero line, and the overall pattern they form. The colors of the AO histogram are crucial for identifying immediate momentum shifts. A green bar indicates that the current bar’s value is higher than the previous bar’s value, suggesting increasing momentum.
A red bar signifies that the current bar’s value is lower than the previous bar’s value, indicating decreasing momentum. These color changes can occur both above and below the zero line.
The zero line in the Awesome Oscillator acts as a pivotal threshold for momentum. When the AO histogram is above the zero line, it signals bullish momentum, indicating that the short-term market force is stronger than the long-term force.
Conversely, when the AO histogram is below the zero line, it suggests bearish momentum, meaning the short-term market force is weaker than the long-term force. A zero line crossover is a significant event, often signaling a potential shift from a bullish to a bearish trend or vice versa.
Traders use these visual cues to confirm existing trends (uptrends, downtrends) or identify potential reversals, guiding their decisions on entry and exit points.
Ready to Elevate Your Trading?
You have the information. Now, get the platform. Join thousands of successful traders who use Volity for its powerful tools, fast execution, and dedicated support.
Create Your Account in Under 3 MinutesHow to Trade the Awesome Oscillator
The Awesome Oscillator offers several distinct trading strategies that help traders identify potential entry and exit points. These strategies leverage the indicator’s ability to signal momentum shifts and trend changes, providing actionable insights for various market conditions. Mastering these approaches can significantly improve trading decisions.
Zero Line Cross Strategy: Buy & Sell Signals
The Zero Line Cross strategy is a fundamental approach to using the Awesome Oscillator, signaling a significant shift in market momentum. A bullish crossover occurs when the AO histogram crosses from below the zero line to above it, indicating that short-term momentum has surpassed long-term momentum.
This event generates a buy signal, suggesting that bullish forces are gaining control. Traders often consider entering a long position as the first green bar appears above the zero line.
Conversely, a bearish crossover happens when the AO histogram crosses from above the zero line to below it. This signals that short-term momentum has fallen below long-term momentum, indicating increasing bearish pressure. This event generates a sell signal, prompting traders to consider exiting long positions or entering short positions.
The Zero Line Cross strategy is straightforward but benefits from confirmation with other indicators due to its potential for false signals in choppy markets.
What is the Awesome Oscillator Saucer strategy?
The Saucer strategy is a specific Awesome Oscillator pattern used to identify short-term momentum changes within an existing trend. A bullish saucer signal occurs when the AO is above the zero line and shows three consecutive bars. The first two bars are red, with the second bar being lower than the first.
The third bar is green and higher than the second. This pattern suggests a temporary dip in bullish momentum, followed by a quick resurgence, generating a buy signal. It indicates that the bullish trend is likely to continue after a brief pause.
A bearish saucer signal appears when the AO is below the zero line, also with three consecutive bars. The first two bars are green, with the second bar being higher than the first. The third bar is red and lower than the second.
This formation indicates a brief increase in bearish momentum, followed by a swift return to selling pressure. This generates a sell signal, suggesting the bearish trend is set to resume. The Saucer strategy is effective for catching minor corrections within stronger trends.
What is the Awesome Oscillator Twin Peaks strategy?
The Twin Peaks strategy utilizes the Awesome Oscillator to pinpoint potential divergence and reversals, often signaling a shift in the market’s direction. A bearish twin peaks setup occurs when the AO histogram is above the zero line, forming two distinct peaks.
The second peak is lower than the first, and there is a trough (valley) between them that remains above the zero line. This pattern, especially when accompanied by rising price action, indicates bearish divergence, suggesting that while price is making higher highs, momentum is weakening. This generates a sell signal.
A bullish twin peaks setup is the inverse, occurring when the AO histogram is below the zero line. Here, two peaks form, with the second peak being higher than the first, and the trough between them remains below the zero line.
When price makes lower lows but the AO shows higher lows (or higher peaks below zero), it indicates bullish divergence, suggesting that selling pressure is waning. This pattern generates a buy signal, indicating a potential bullish reversal. The Twin Peaks strategy is a powerful tool for anticipating significant trend changes.
Advanced AO Techniques: Divergence & Confluence
Beyond its basic strategies, the Awesome Oscillator offers advanced techniques like divergence and confluence, which significantly improve its predictive power. These methods allow traders to identify hidden signals and improve the reliability of their trading decisions, moving beyond simple momentum readings.
What is divergence in Awesome Oscillator?
Divergence in the Awesome Oscillator is a powerful signal that indicates a potential trend reversal by showing a discrepancy between price action and momentum. Bullish divergence occurs when the price of an asset makes a lower low, but the AO makes a higher low.
This suggests that despite the price continuing to fall, the bearish momentum is weakening, hinting at a potential upward reversal. Traders often look for a bullish Twin Peaks setup below the zero line as a form of bullish divergence.
Conversely, bearish divergence happens when the price makes a higher high, but the AO makes a lower high. This indicates that while the price is still rising, the bullish momentum is fading, signaling a potential downward reversal. A bearish Twin Peaks setup above the zero line is a classic example of bearish divergence.
Recognizing divergence provides an early warning system for trend changes, allowing traders to anticipate market shifts before they become obvious in price action.
How to combine Awesome Oscillator with other indicators?
Improving accuracy in trading often involves combining the Awesome Oscillator with other indicators, a concept known as confluence. Combining the Awesome Oscillator with other tools like fractals or support/resistance levels can improve signal reliability.
This approach helps filter out false signals and provides stronger confirmation for trading decisions. For instance, a bullish Zero Line Cross on the AO gains more credibility if it also coincides with a breakout above a significant resistance level or a bullish cross on a moving average convergence divergence (MACD).
Other Bill Williams tools, such as the Alligator Indicator, can also be effectively combined with the AO. The Alligator, which uses multiple moving averages, helps identify the presence and direction of a trend. When the Alligator’s “jaws” are open and trending, an AO signal can be used for entries within that confirmed trend.
This integration of multiple indicators, especially those designed by the same developer, creates a robust framework for validating trading signals.
What are the limitations of the Awesome Oscillator? How to mitigate false signals?
The Awesome Oscillator, while effective, has inherent limitations, particularly its tendency to generate false signals in specific market conditions. The Awesome Oscillator is particularly effective in identifying momentum shifts and confirming trends, but it can generate false signals in choppy or sideways markets.
In a choppy market or sideways market, where prices fluctuate without a clear direction, the AO can frequently cross the zero line or form saucer patterns that do not lead to sustained moves. This can lead to whipsaws and unprofitable trades if used without additional confirmation.
To mitigate these false signals, traders can implement several strategies. First, using the AO on higher timeframes (e.g., daily or weekly charts) often provides more reliable signals by smoothing out short-term noise. Second, always confirm AO signals with other trend confirmation indicators or price action analysis.
For example, wait for price to break a key support or resistance level after an AO signal. Third, incorporating robust risk management techniques, such as proper position sizing and stop-loss orders, is crucial to protect capital when false signals occur.
Why Beginners Struggle with the Awesome Oscillator?
Beginners often face specific challenges when attempting to use the Awesome Oscillator, stemming from both technical misinterpretations and psychological factors. Addressing these common pitfalls is essential for effective integration of the AO into a trading strategy, moving beyond mechanical application to a more holistic approach.
Overcoming Trading Psychology Pitfalls
The human factor significantly impacts a trader’s success, often leading to struggles even with effective indicators like the Awesome Oscillator. Emotional decision-making, such as fear of missing out (FOMO) or revenge trading, significantly contributes to trading losses, especially when misinterpreting indicator signals.
New traders might overtrade, chasing every green bar, or exit prematurely due to fear, especially when the AO gives a false signal. Impatience can lead to entering trades before a clear pattern, like a Saucer or Twin Peaks, fully forms.
Overcoming these trading psychology pitfalls requires discipline and a structured approach. Develop a clear trading plan that outlines specific entry and exit criteria based on AO signals, and stick to it without emotional interference. Practice mindfulness and emotional detachment from trade outcomes.
Focus on process over profit in the short term, understanding that consistent application of a sound strategy is key. This approach helps manage the psychological impact of market fluctuations and prevents impulsive decisions.
Essential Risk Management with the Awesome Oscillator
Risk management is an essential component of any trading strategy, especially when using momentum indicators like the Awesome Oscillator, which can generate false signals. Proper risk management ensures the protection of capital and promotes long-term sustainability in trading.
Traders must determine their position sizing based on their total capital and the maximum percentage they are willing to risk per trade. A common rule suggests risking no more than 1-2% of capital on any single trade.
Setting a stop loss is crucial to limit potential losses if a trade moves against the anticipated direction. For AO strategies, stop-loss levels can be placed just beyond recent swing highs or lows, or based on volatility measures. Equally important are profit targets, which define where a trader will exit a profitable trade.
These can be set at previous resistance/support levels or using a fixed risk-reward ratio, such as 1:2 or 1:3. By meticulously planning stop losses and profit targets, traders can manage the inherent risks associated with AO signals.
| Risk Component | Description | Example |
| Max Risk per Trade | % of capital willing to lose | 1-2% |
| Position Sizing | Number of units traded | Varies by capital |
| Stop Loss | Price point to close losing trade | Below recent swing low |
| Profit Target | Price point to close winning trade | At next resistance |
| Risk-Reward Ratio | Potential gain vs. potential loss | 1:2 (e.g., $100 risk for $200 gain) |
Turn Knowledge into Profit
You've done the reading, now it's time to act. The best way to learn is by doing. Open a free, no-risk demo account and practice your strategy with virtual funds today.
Open a Free Demo AccountSetting Up & Backtesting the Awesome Oscillator
Successfully implementing the Awesome Oscillator involves correctly setting it up on your chosen trading platform and rigorously backtesting your strategies. These steps are crucial for ensuring that the indicator is used effectively and that your trading approach is validated against historical data.
How to set up Awesome Oscillator on TradingView?
Setting up the Awesome Oscillator on your trading platform, such as TradingView or MetaTrader 4/5, is a straightforward process. On TradingView, navigate to the “Indicators” button at the top of the chart interface. In the search bar, type “Awesome Oscillator” and select it from the list.
The indicator will then appear as a histogram below your price chart. Most platforms will automatically apply the default settings, which are typically the 5-period and 34-period simple moving averages of the midpoint price. These default settings are often sufficient for the AO, as they are part of Bill Williams’ original design.
Familiarizing yourself with the platform’s interface ensures quick and accurate application of the indicator.
What timeframe is best for Awesome Oscillator?
- Choosing the right timeframe for your Awesome Oscillator strategy depends heavily on your trading style and goals
- For day trading, shorter timeframes like 15-minute or 1-hour charts can be used to capture quick momentum shifts
- However, these timeframes are more susceptible to noise and false signals
- For swing trading, which involves holding positions for several days to weeks, daily or 4-hour charts are generally more reliable
- These longer timeframes filter out much of the short-term market noise, providing clearer and more sustained signals
- Consistency in the chosen timeframe is key, as switching between them can lead to conflicting signals and confusion
- Generally, higher timeframes offer more robust signals for trend confirmation.
How to backtest Awesome Oscillator strategy?
Backtesting an Awesome Oscillator strategy is essential for validating its effectiveness before applying it to live trading. Backtesting involves applying your chosen AO strategy to historical price data to see how it would have performed. The process typically includes: 1.
Define Your Strategy: Clearly outline the exact entry and exit rules based on AO signals (e.g., “Buy when AO crosses zero line and turns green”). 2. Select a Market and Timeframe: Choose the asset (e.g., EUR/USD, AAPL) and the timeframe you will test. 3.
Go Through Historical Data: Manually or using backtesting software, move through past charts bar by bar, applying your rules. 4. Record Results: Document every trade, including entry price, exit price, profit/loss, and reasons for entry/exit. 5. Analyze Performance: Calculate metrics like win rate, average profit per trade, drawdowns, and total profitability.
This rigorous process helps identify the strengths and weaknesses of your strategy. For advanced users, successful backtested AO strategies can even be integrated into automated trading systems, further improving their application.
Awesome Oscillator: A Comparative Analysis
The Awesome Oscillator is a unique momentum indicator, but understanding its relationship to other popular tools provides crucial context. Comparing it with indicators like MACD, Stochastic Oscillator, and RSI highlights their distinct characteristics, calculation bases, and optimal use cases. This comparison helps traders choose the most appropriate tool for their specific analytical needs.
| Indicator | Calculation Basis | Key Signals | Strengths | Weaknesses | Best Use Cases |
| Awesome Oscillator | 5-period SMA of Midpoint – 34-period SMA of Midpoint | Zero Line Cross, Saucer, Twin Peaks, Divergence | Fast momentum shifts, Bill Williams’ system | Lagging, false signals in choppy markets | Trend confirmation, early reversal detection |
| MACD | 12-period EMA – 26-period EMA, Signal Line (9-period EMA of MACD) | Crossover of MACD and Signal Line, Divergence | Trend-following, momentum, clear signals | Lagging, less effective in sideways markets | Trend identification, momentum confirmation |
| Stochastic Oscillator | (Close – Lowest Low) / (Highest High – Lowest Low) | Overbought/Oversold levels (20/80), Crossovers | Range-bound markets, fast signals | Whipsaws in strong trends, false signals | Reversals in non-trending markets |
| RSI | Average Gains / Average Losses | Overbought/Oversold levels (30/70), Divergence | Momentum strength, trend confirmation | Can stay overbought/oversold in strong trends | Identifying trend strength, potential reversals |
Key Takeaways
- The Awesome Oscillator (AO) is a momentum indicator by Bill Williams, comparing short-term and long-term midpoint SMAs to identify market direction and strength.
- Key trading strategies include the Zero Line Cross, Saucer patterns for short-term shifts, and Twin Peaks for anticipating trend reversals through divergence.
- While effective, the AO requires confirmation from other indicators and robust risk management to mitigate false signals, especially in choppy markets.
- Beginners should focus on understanding AO mechanics, practicing disciplined trading psychology, and backtesting strategies on higher timeframes for reliability.